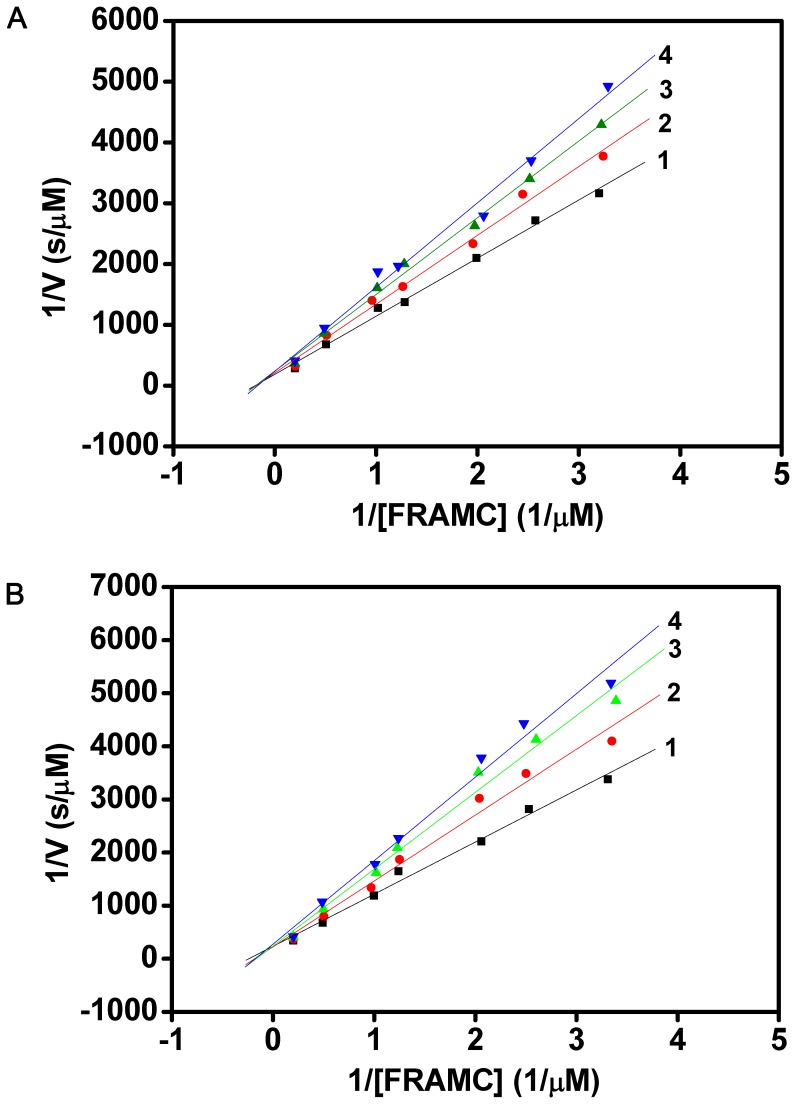
Figure 5. The Lineweaver-Burk plots for the inhibition of papain by AcCYS and AcCYS-DL.
The inhibition of papain by AcCYS and AcCYS-DL is shown in (A) and (B) respectively. The initial rates of cleavage of a fluorogenic substrate, Z-Phe-Arg-7-amido-4-methylcoumarin (FRAMC) hydrochloride by papain were obtained spectrofluorometrically with excitation and emission wavelengths at 346 and 450 nm, respectively. Line 1 represents papain activity (2 nM) in the absence of inhibitor. Line 2–4 show the enzyme activity in the presence of 40, 60, 80 pM cystatin, respectively. Both AcCYS and AcCYS-DL strongly inhibited papain with inhibitory constant KI of 2.0±0.2×10⁻¹⁰ M and 1.4±0.1×10⁻¹⁰ M, respectively.

