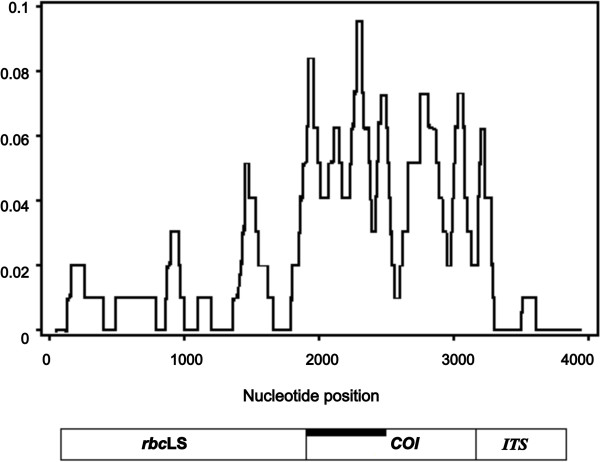
Figure 2.
Sliding window plot of nucleotide divergence for three gene regions (rbc LS, COI , and ITS) between the TYP and SHA forms of Saccharina japonica. Window sizes are 100 nucleotides with one-nucleotide increments. A schematic representation of the regions is displayed at bottom. The thick black line marks the COI region investigated by McDevit and Saunders [43].

