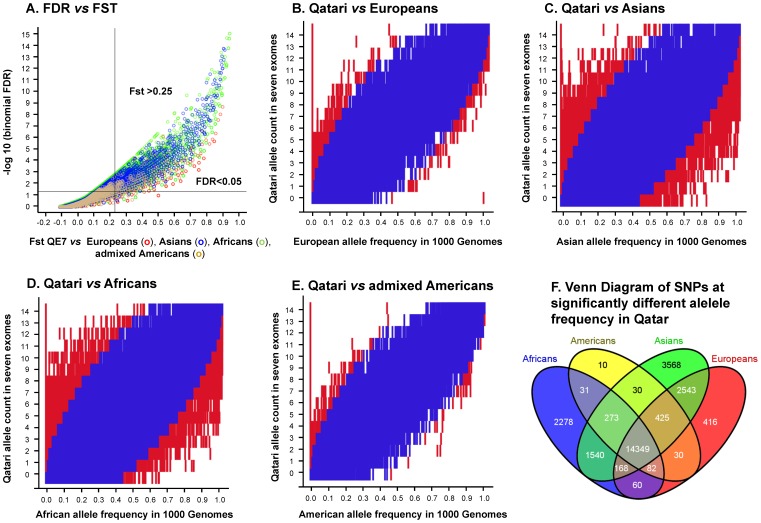
Figure 4. Identification of autosomal exome SNPs in the QE7 Qatari individuals with an allele frequency distinct from at least one continent (Europe, Asia, Africa, the Americas) as estimated from exomes vs 1000 Genomes.
A. Illustration of threshold selection. Fixation index (Fst; x-axis) and -log10 (q-values; y-axis) for a binomial test for all SNPs assessed versus each continent (red = QE7 vs Europeans, green = QE7 vs Asians, blue = QE7 vs Africans, tan = blue = QE7 vs Americans). Shown is the threshold selected for identifying enriched SNPs; Fst >0.25 [43] and FDR <0.05 [44]. B–E. Heat maps of the false discovery rate [44] for enrichment of higher or lower than expected number of alternative alleles tested on 126,924 exome SNPs. Shown is the allele counts for the 7 Qatari exomes (y axis) vs the continental alternative allele frequency in 1000 Genomes continental populations (x axis). The map shows combined FDR and Fst thresholds for all SNPs (enriched = red = Fst >0.25 and FDR <0.05; not enriched = blue = Fst <0.25 or FDR >0.05; white = no observations). B. Qataris vs Europeans (EUR), C. Qataris vs Asians (ASN), and D. Qataris vs Africans (AFR). D. Qataris vs Americans (AMR). E. Venn diagram of 25,803 SNPs enriched in Qataris vs at least one continent.

