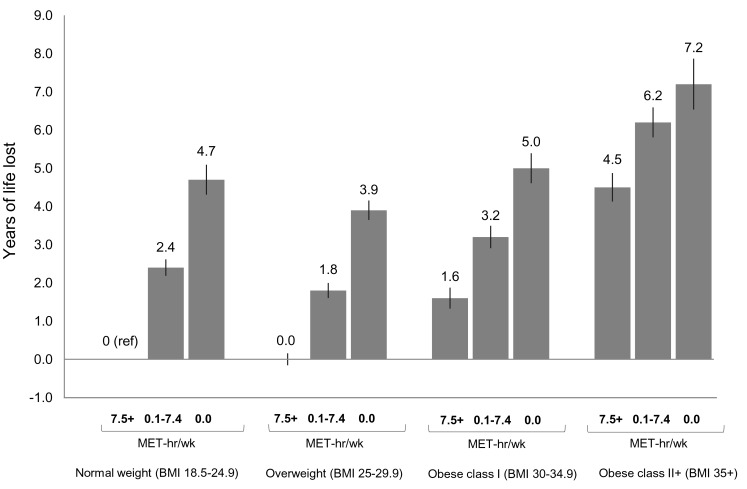
Figure 2. Years of life expectancy lost after age 40 in relation to joint categories of physical activity level and body mass index.
The bars indicate the number of years of life lost for each category, and the vertical lines are the 95% CIs. The reference category is normal weight and 7.5+ MET-h/wk of physical activity (i.e., meeting US recommended physical activity levels). Normal weight is a BMI of 18.5–24.9 kg/m2, overweight is a BMI of 25.0–29.9 kg/m2, obese class I is a BMI of 30.0–34.9 kg/m2, and obese class II+ is a BMI of 35.0 kg/m2 or greater. Years of life expectancy lost after age 40 were derived using direct adjusted survival curves [31],[32] for participants who were 40+ y of age at baseline and not underweight (96.5% of participants). Life expectancy models used age as the underlying time scale and were adjusted for gender, alcohol consumption (0, 0.1–14.9, 15.0–29.9, 30.0+ g/d), education (did not complete high school, completed high school, post-high-school training, some college, completed college), marital status (married, divorced, widowed, unmarried), history of heart disease, history of cancer, and smoking status (never, former, current).

