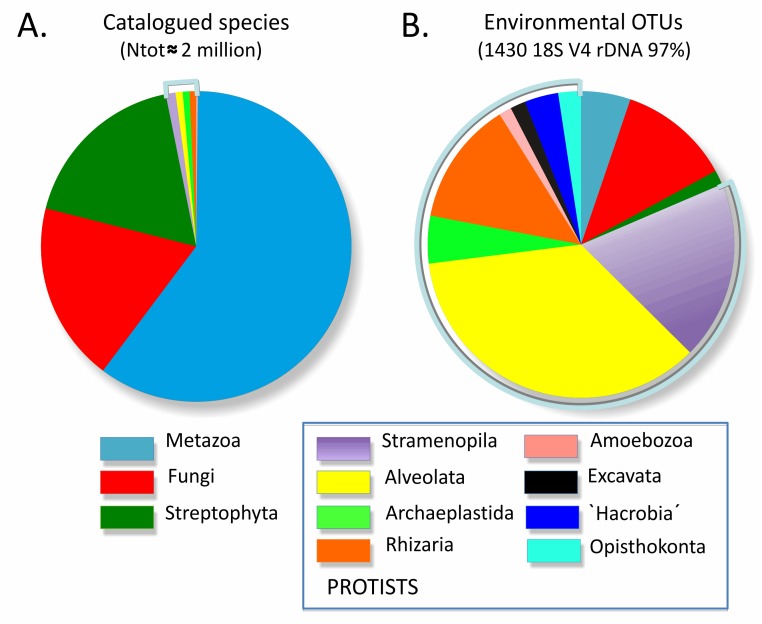
Figure 1. Morphological versus genetic views of total eukaryotic diversity.
(A) Relative numbers of described species per eukaryotic supergroup—see Table S1 for a detailed count per division/class. (B) Relative number of V4 18S rDNA Operational Taxonomic Units (97%) per eukaryotic supergroup, based on 59 rDNA clone library surveys of marine, fresh-water, and terrestrial total eukaryotic biodiversity (as listed in [55]).

