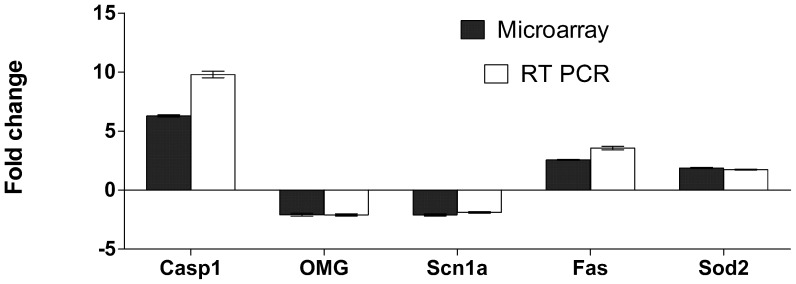
Figure 3. RT- PCR validation of 5 genes expressed differentially in the spinal cords of Lewis rats with MBP induced EAE.
Tissue samples were snap frozen in liquid nitrogen and stored at −80°C prior to total RNA preparation using the QIAGEN RNeasy Lipid tissue kit. RNA quality analysis was carried out on the BioRadExperion automated electrophoresis system. All preparations used in both assays had RNA quality indicator (RQI) values of >9.5. For RT-PCR, total RNA was reverse transcribed and amplified as described in the methods. Analysis of selected genes up or down regulated at the peak of disease in EAE. Bars represent the average fold change between expression in the spinal cord level at peak of disease compared to normal healthy animals (+/− SEMs, Microarray n = 4, RT-PCR n = 8). Dark columns represent fold change derived from the microarray data. Similar amplification patterns were obtained from RT-PCR amplification of the same total RNA samples and a second set of 4 animals samples at an identical time point.

