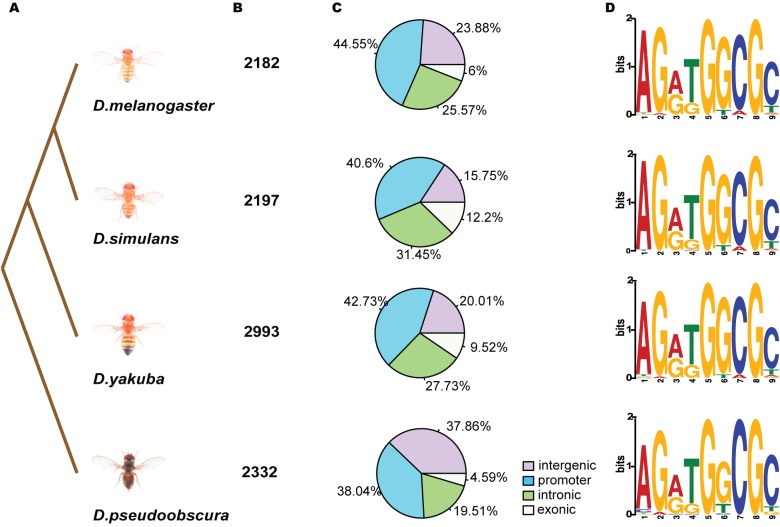
Figure 1. Conserved binding preference of CTCF.
(A) Topological illustration of the phylogenetic relationships between the four Drosophila species in our study. (B) The number of CTCF binding peaks identified in ChIP-seq experiments in the four Drosophila species. (C) Genomic distribution of CTCF binding sites in the four Drosophila species. The percentages of CTCF binding sites distributed in different genomic locations are shown in the four pie charts: intergenic (>1 kb to nearest TSS, purple), promoter (<1 kb to nearest TSS, light blue), intronic (light green), and exonic (white). In all four species, >90% of the binding sites reside in the noncoding regions with highest percentages in promoter regions. (D) Species-specific binding motifs. The 9 bp core motif for each species is de novo generated by MEME using the top 2000 ChIP-seq-enriched CTCF binding site DNA sequences.

