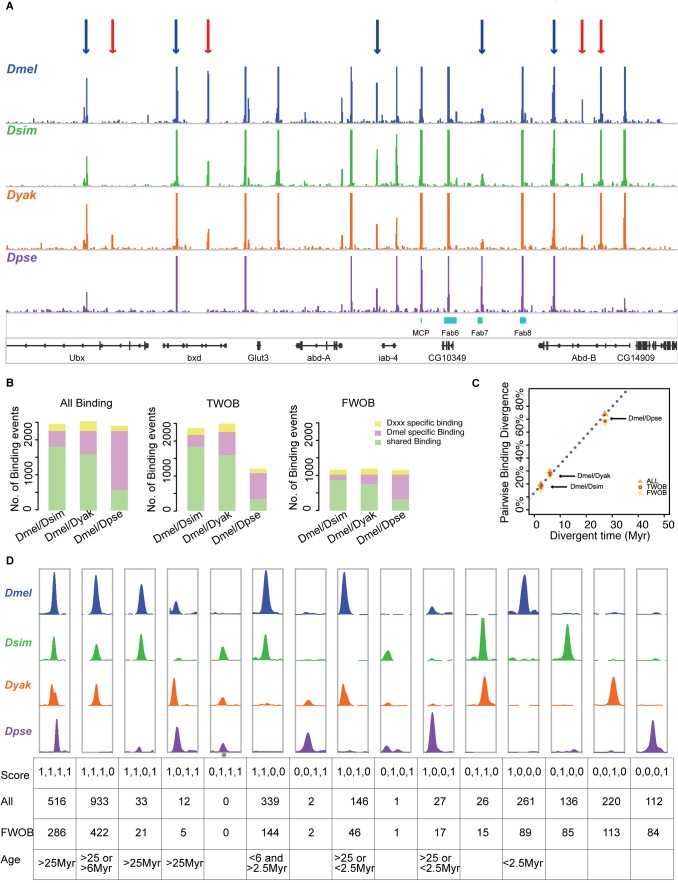
Figure 2. Diverged CTCF binding between Drosophila species.
(A) Evolutionary dynamics of CTCF binding profiles at the Bithorax complex region. The four colored wiggle file tracks show the ChIP CDP enrichment scores estimated from our quantitative analysis pipeline for the four species: D. melanogaster (blue), D. simulans (green), D. yakuba (orange), and D. pseudoobscura (purple). The four tracks are at the same scale, with the height of each curve at each coordinate denoting the enrichment score values. In the top panel, the blue arrows point to examples of conserved binding events across the four species, and the red arrows point to examples of diverged binding events between species. The fifth track shows the boundaries of previously identified insulator elements (in sky blue). The last track shows the genes in the genomic region. (B) Number of conserved and diverged binding events. From left to right, the three bar plots show the number of D. melanogaster–specific (pink), shared (blue), and non–D. melanogaster (D.xxx, yellow) specific binding events between each of the species pairs (D. melanogaster/D. simulans, D. melanogaster/D. yakuba, and D. melanogaster/D. pseudoobscura) for all binding events possibly identified (All, left), Two-Way Orthologous Binding events (TWOB, middle), and Four-Way Orthologous Binding events (FWOB, right). TWOB is defined as a binding event identified in regions where the sequence identity between the two compared species is >50%. FWOB is defined as a binding event identified in regions where the sequence identity across all four species is >50%. (C) Linear increase of pair-wise binding divergence with species divergent time. The binding divergence is calculated as the percent of D. melanogaster binding events not shared with the non–D. melanogaster species in each pair-wise comparison. Different shaped and colored points represent different groups of binding events as indicated by the legend. The red dashed line depicts the fitted linear regression line of TWOB binding divergence with divergent time. (D) Evolutionary groups of CTCF binding events. Top panel, representative dynamic binding profiles in the four Drosophila species (D. melanogaster, blue; D. simulans, green; D. yakuba, orange; D. pseudoobscura, purple) illustrating examples of 15 mutually exclusive evolutionary groups of binding status. The height at each binding curve denotes the ChIP CDP enrichment score estimated from our analyses pipeline. For each evolutionary group, the y-axes of the four binding curves are at the same scale. The first row of the lower table shows the Boolean conservation score corresponding to the binding profiles, where 0 indicates absence of binding event and 1 indicates the presence of binding events. The second and third rows of the lower table summarize the number of all binding events (second row) and FWOB events (third row) falling into each evolutionary group. The last row of the lower table shows the inferred evolutionary age for different groups of D. melanogaster binding events using Parsimony methods. * As for the evolutionary group with boolean conservation score 0,1,1,1, there is no instance identified in our analyses, so the representative binding profile in the figure is generated by artificially modifying another binding profile to represent the specific category.

