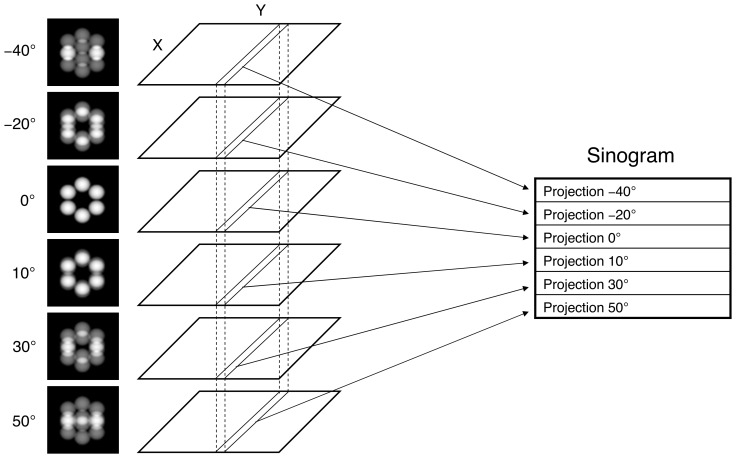
Figure 4. How a sinogram is built.
All projection images are stacked and the 1D projections (or, simply, projections) that belong to the same slice (those between the vertical dotted lines) are grouped into a sinogram. This process is repeated for every slice. Therefore, there will be as many sinograms as slices.

