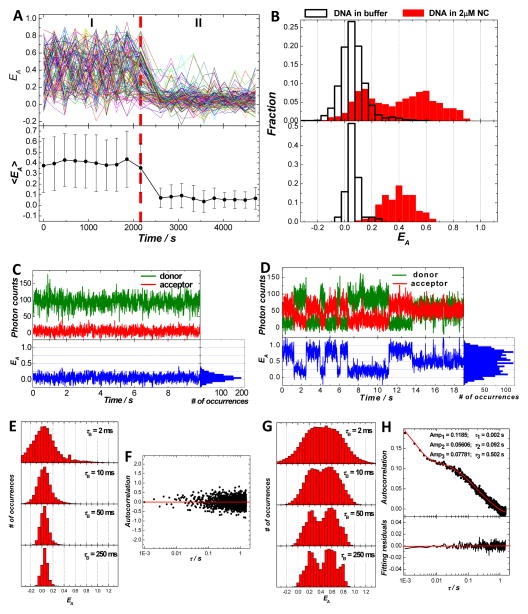
Figure 1.
Conformational dynamics of TAR-cTAR DNA duplexes in the presence and absence of NC. (A) SM-FRET trajectories (obtained in the image scanning mode) of 120 molecules found in a 30 μm × 30 μm region (each colored line corresponds to a single molecule) and the corresponding molecularly-averaged FRET trajectory. The dual dye-labeled TAR-cTAR DNA duplexes were immobilized on a coverslip. During time periods I and II, 2μM NC and buffer were flowed into the reaction chamber, respectively. (B) FRET histograms of all spectroscopic occurrences (upper panel) and time-averaged FRET (lower panel) of the TAR-cTAR duplex molecules in 2μM NC and buffer. Donor, acceptor and the corresponding FRET trajectory (obtained in the individual trajectory mode) collected on one representative molecule in buffer (C) and in 2 μM NC (D) with a bin time of 10 ms. (E) The ensemble FRET histograms obtained from FRET trajectories of 64 molecules in buffer with a bin time τB of 2 ms, 10 ms, 50 ms, and 250 ms. (F) The ensemble FRET autocorrelation obtained from FRET trajectories of the 64 molecules with a time resolution of 1 ms. (G) The ensemble FRET histograms obtained from FRET trajectories of 64 molecules in 2 μM NC with a bin time τB of 2 ms, 10 ms, 50 ms, and 250 ms. (H) The ensemble FRET autocorrelation obtained from FRET trajectories of the 102 molecules with a time resolution of 1 ms.

