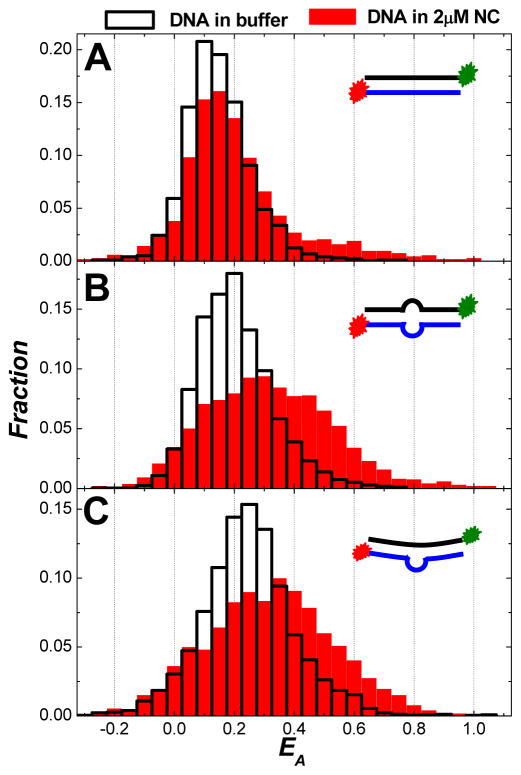
Figure 7.
FRET histograms of all spectroscopic occurrences (obtained in image scanning mode) for DNA duplexes in 2μM NC and in buffer for: (A) miniTAR-minicTAR duplexes; (B) miniTAR-minicTAR mismatch1 duplexes; and (C) miniTAR-minicTAR mismatch2 duplexes. The insets in each panel show the cartoons of each DNA construct used in the SM-FRET measurements.

