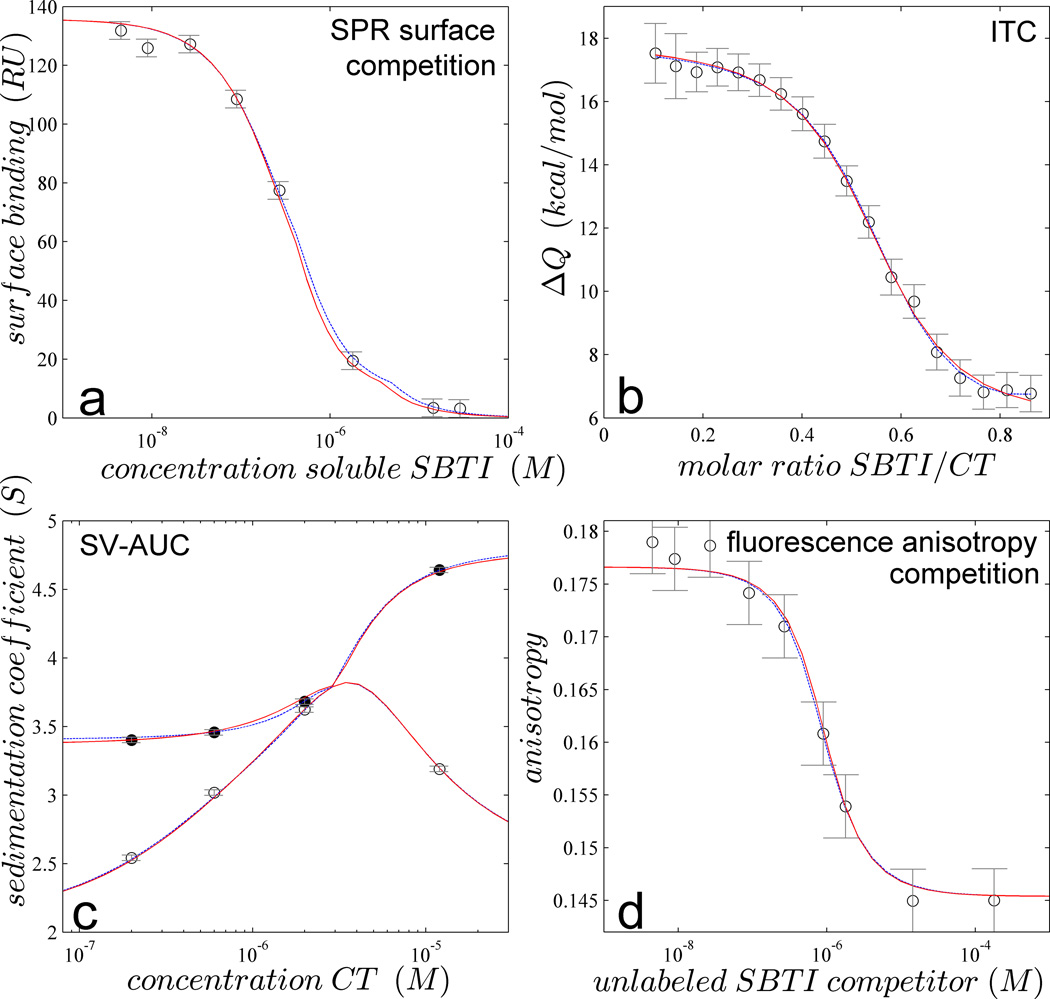
Figure 1.
Global multi-method analysis of the two-site interaction of CT binding SBTI. (a) Steady-state SPR biosensor signals from binding of 0.3 µM CT to surface immobilized SBTI in the presence of different concentrations of soluble SBTI (symbols); (b) Normalized heats of reaction measured in calorimetry from the titration of 20 µM CT with aliquots of 84 µM SBTI (symbols); (c) Weight-average (open symbols) and reaction boundary sedimentation coefficients (filled symbols) in SV-AUC for 1.8 µM SBTI with different concentrations of CT; (d) fluorescence anisotropy of a mixture of 0.09 µM DyLight488-labeled SBTI and 1 µM CT with a range of concentrations of unlabeled SBTI (symbols). In all panels the best-fit GMMA model is shown as red solid line, with parameter values and error estimates as shown in magenta in Figure 2 (‘GMMA 4’). For comparison, best separate fits to individual data sets are shown as dotted blue line (virtually superimposing the red curve), with parameter estimates as shown in Figure 2.

