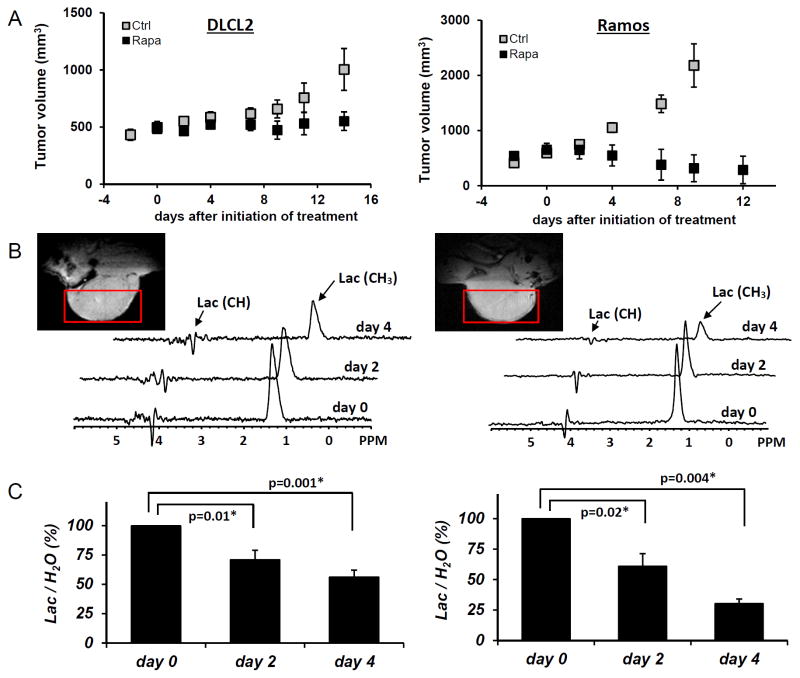
Figure 4.
Rapamycin-induced inhibition of tumor growth and glucose metabolism in vivo. Xenotransplants of DLCL2 cells (left panel) and Ramos cells (right panel). Drug treatments are in Materials and Methods. A: tumor growth delay curve with the data representing mean±SD (n≥5 in each group). B: Times course in vivo localized MRS of tumor with rapamycin treatment. Tumor MRI images and the selected voxels for MRS are also displayed. C: Lac/H2O ratios normalized to the pretreatment values for the rapamycin-treated tumors are presented as mean±SE (n=5). Statistically significant changes in Lac/H2O were observed at 48 hr and after from initiation of rapamycin treatment in both xenografts (P values are displayed. * denotes statistical significance) while control tumors (n=5) did not have significant changes in Lac/H2O until 96 hr.

