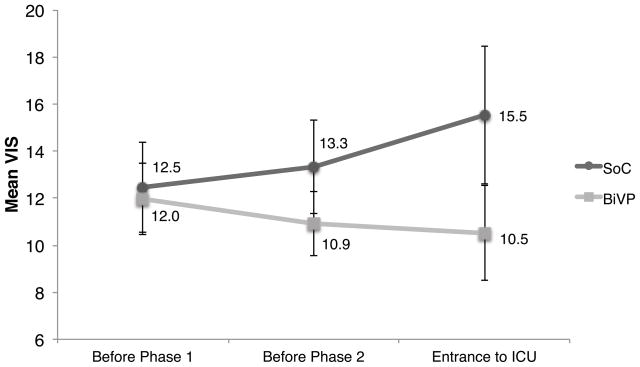
Figure 2. Diverging time course from randomization to ICU admission in the standard of care (SOC, n=26) and biventricular pacing groups (BiVP, n=24).
VIS increased from 12.5±1.9 at randomization to 15.5±2.9 at ICU entry in the SOC group but decreased from 12.0±1.5 to 10.5±2.0 in the BiVP group. The slopes of these VIS-time relations are significantly different by linear mixed effects analysis (p=0.02). The time between Phase I and Phase II averaged 66±30 minutes and 65±35 minutes between Phase II and ICU entry. Pacing was optimized at time points VIS1 and VIS2.

