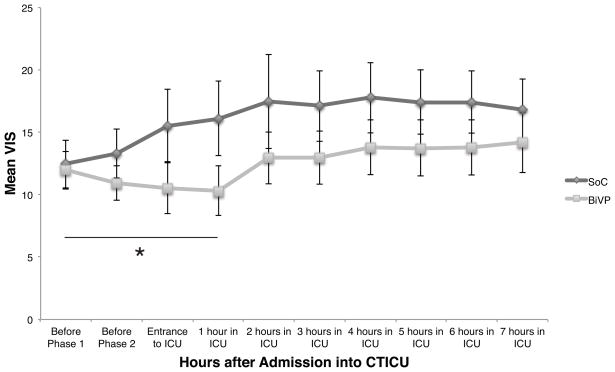
Figure 3. VIS from randomization until 7 hours after ICU entry.
Hourly averages of VIS are shown for the standard of care (SoC, n=26) and biventricular pacing (BiVP, n=24) groups. The slopes of the ViS-time relations are significantly different through the first hour in the ICU by linear mixed effects analysis (p=0.0015). Pacing was optimized at time points VIS1 and VIS2. Data collection was limited to 7 hours because premature Swann-Ganz catheter removal disqualified one patient from continuing study.

