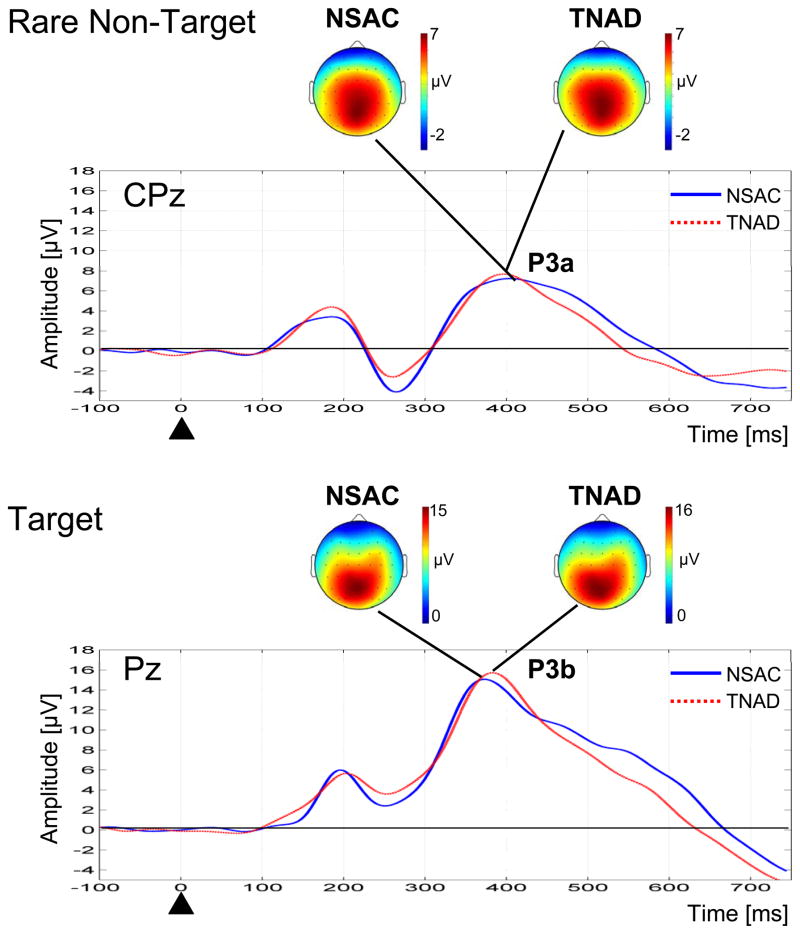
Figure 1.
Grand average ERP difference waveforms for the Rare Non-Target (Rare Non-Target – Standard condition) at electrode site CPz and Target (Target – Standard condition) at electrode site Pz, showing comparison of NSAC and TNAD groups. Grand average spatial maps are shown for the location of the P3 peaks for both the NSAC and TNAD groups.

