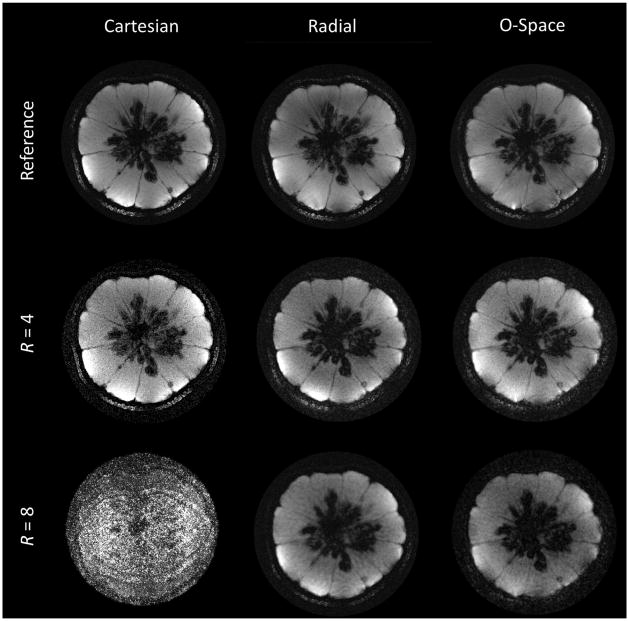
FIG. 7.
The top row compares a fully sampled Cartesian image (384 × 384) with 256-spoke radial and O-Space images each reconstructed to 512 × 512. In subsequent rows, images are reconstructed from 4-fold and 8-fold undersampling of the datasets (64 and 32 spokes, respectively). FOV = 10 cm, TR = 750 ms, TE = 9 ms, 1 average.

