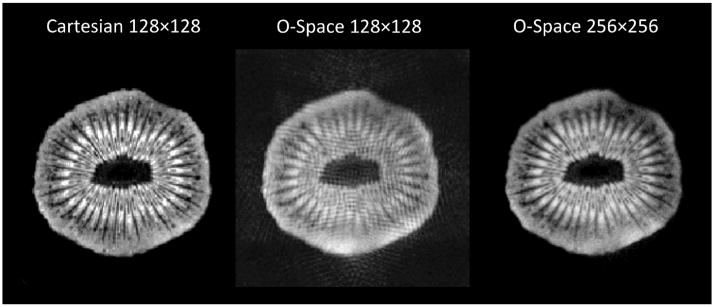
FIG. 9.
From left to right, 6 cm FOV Cartesian reference image at 128 × 128, 256-spoke O-Space dataset reconstructed to 128 × 128, and the same O-Space data reconstructed to 256 × 256. The amplitudes of the Z2 and linear SEMs are 1360 Hz/cm2 and 13,196 Hz/cm, respectively, causing over 2p radians of phase evolution between neighboring voxels on the 128 × 128 grid. TR = 1000 ms, TE = 10 ms, 1 average.

