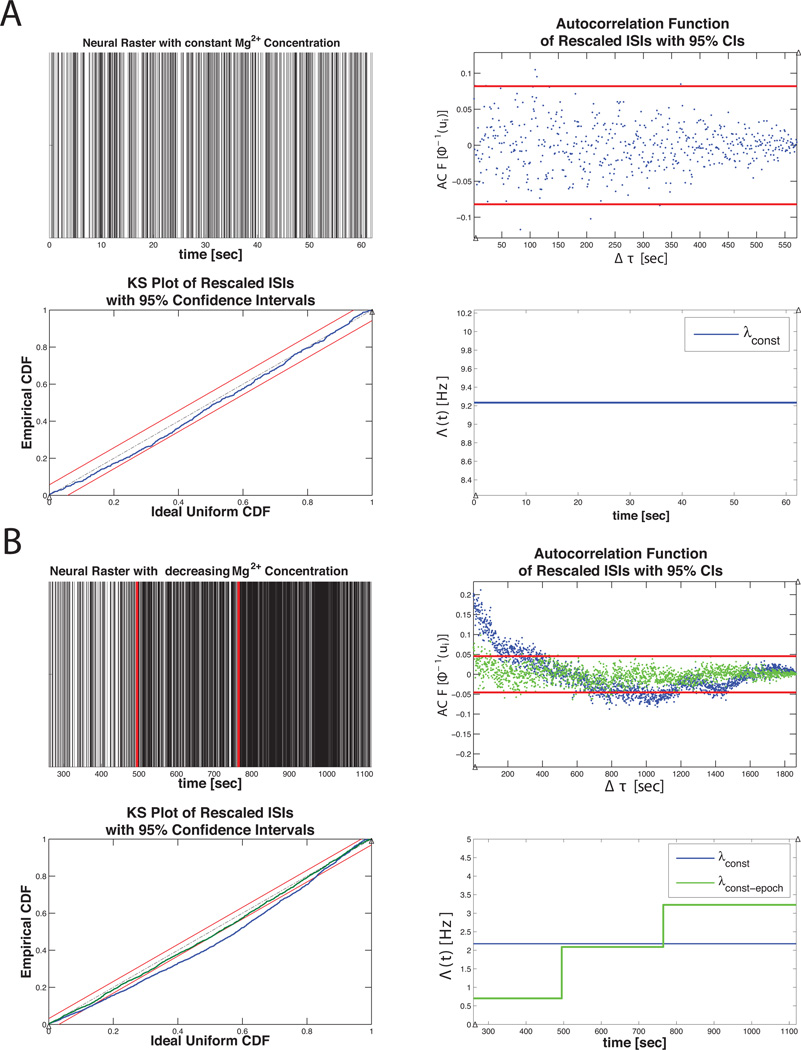
Figure 10. Example 1 Results.
A) nSTAT results summary for the constant baseline firing rate model (Equation 20) for the mEPSC data in Figure 3 B). (top, left to right) original neural raster, autocorrelation function of the us’s, K-S Plot, and conditional intensity function estimate. B) (top, left to right) Raster of mEPSC data under varying magnesium concentration, autocorrelation function of the us’s, K-S Plot and CIF estimate. Note that the piecewise constant rate model yields a K-S plot that falls within the 95% confidence bands and produces rescaled event times whose autocorrelation function is closer to zero across all lags – suggesting independence of the rescaled times under λCONST-EPOCH. The estimated CIF (lower right panel) is able to capture the increased rate that is observed in Figure 3 C).

