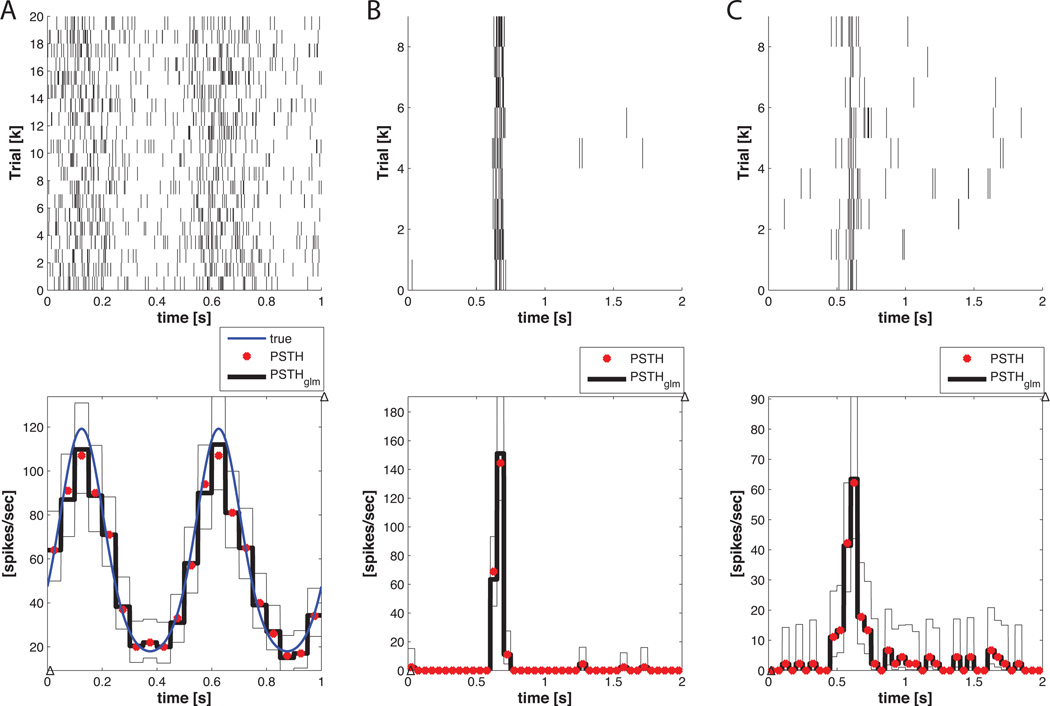
Figure 12. Example 3 PSTH Results.
A) (top) Raster of 20 cells obtained from the conditional intensity function in Equation 24 via the point process thinning algorithm. (bottom) Comparison of PSTH (red) and PSTH-GLM (black) with 50ms seconds bins to the actual conditional intensity function (blue). Note that the standard PSTH and the PSTH-GLM match exactly. Confidence bands for the PSTH-GLM are shown by the opaque black lines. B) Neuron #6 raster (top) with corresponding PSTH and PSTH-GLM (bottom). C) Neuron #1 raster (top) and corresponding PSTH and PSTH-GLM (bottom). Confidence bands for the PSTH-GLM are indicated by the thin black lines.

