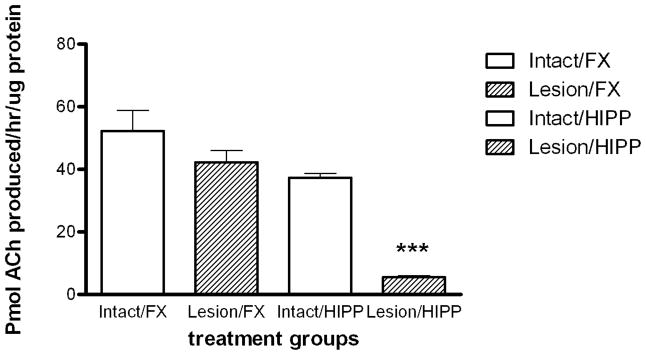
Figure 1. ChAT activity.
The effect of SAP lesions on ChAT activity in the frontal cortex (Lesion/FX) and hippocampus (Lesion/HIPP) relative to control (Intact/FX and Intact/HIPP). Bars show group mean ± SEM. Data were analyzed by one-way ANOVA followed by Newman-Keuls multiple comparison post-hoc test (*** = p<0.001). There was an 80.3% decrease in ChAT activity in hippocampus of lesioned versus intact rats (7.07 ± 0.98 versus 35.90 ± 1.26 pmol ACh produced/hr/μg protein; p<0.001) n=30–97.

