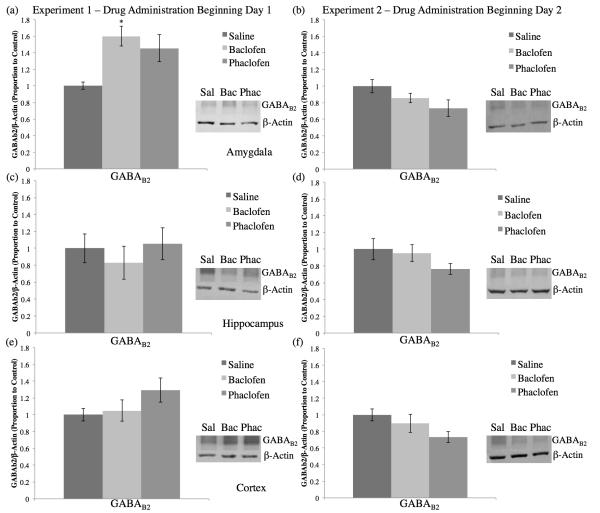
Figure 7.
Average proportion of GABAB2/ -actin to control (±SEM) for tissue from the amygdala (a, b), hippocampus (c, d), and cortex (e, f) for Experiment 1 (a, c, e) and Experiment 2 (b, d, f). The baclofen group in Experiment 1, drug administration beginning Day 1, had demonstrated significantly more GABAB2 total protein levels compared to the saline group in the amygdala (a; *=significantly different from saline, p<0.05). There were no significant differences in GABAB2 total protein levels compared to the saline group for Experiment 1 in the hippocampus (c) or cortex (e), nor for Experiment 2 in the amygdala (b), hippocampus (d), or cortex (f).

