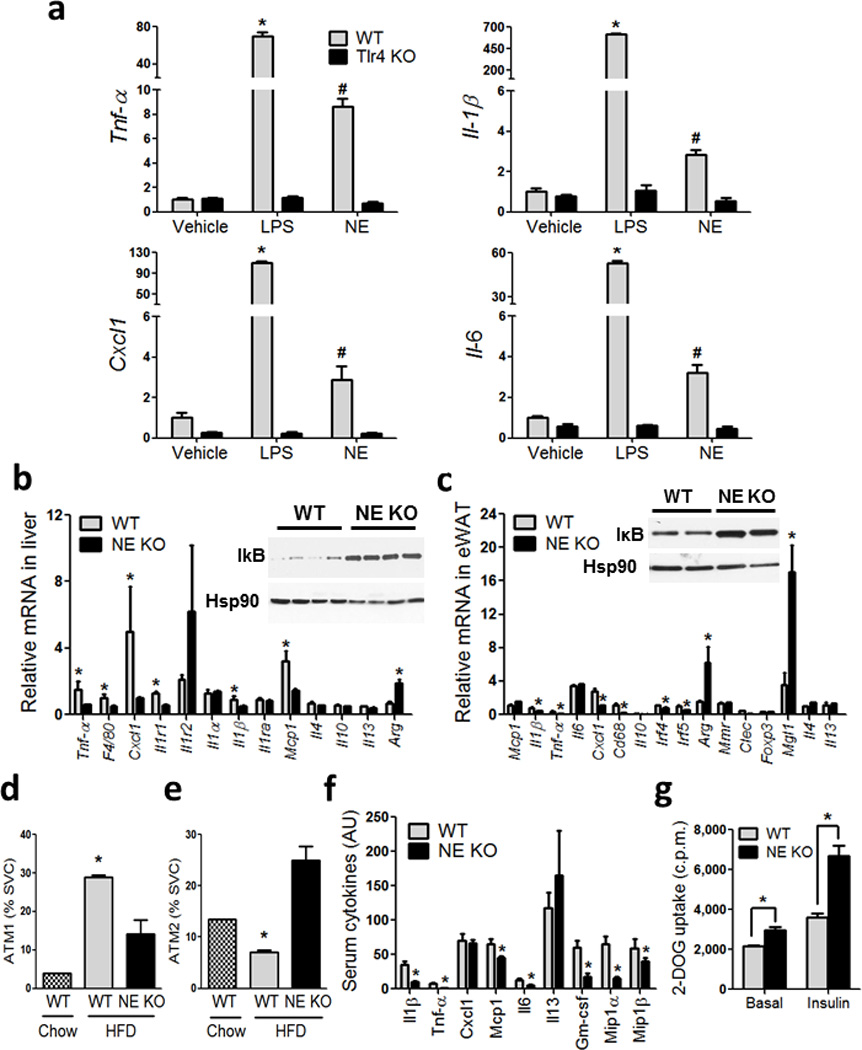
Figure 4. NE KO mice have decreased inflammatory tone.

(a) qPCR of the indicated genes from IP–Macs harvested from WT and Tlr4 KO mice, treated with vehicle, LPS and recombinant mouse NE. *, represents significantly higher than all other treatment groups, and #, represents significantly lower than WT LPS, and significantly higher than all other treatment groups. * significance at p<0.05 using Student’s t test.
(b) qPCR analysis on inflammatory gene expression in liver, and (c) adipose tissue, from WT and NE KO mice on HFD. Western blot for liver IκB and Hsp90 (b) inset, and adipose IκB and Hsp90 (c) inset. * indicates significance at p<0.05 using Student’s t test.
(d) SVCs from eWAT stained with F4/80, Cd11b, and Cd11c and analyzed by FACS. Cells that are triple positive for all three markers are referred to as ATM1, and (e) cells that are positive for both F4/80 and Cd11b and negative for Cd11c are referred to as ATM2. * indicates significance at p<0.05 using two–way ANOVA and Bonferroni post–test.
(f) Serum cytokines measured using the Millipore Luminex assay from WT and NE KO mice on HFD. * indicates significance at p<0.05 using Student’s t test.
(g) Glucose uptake in eWAT explants harvested from WT and NE KO mice and incubated ex vivo in the absence and presence of insulin, followed by measurement of 2–deoxyglucose (2–DOG) uptake. * indicates significance at p<0.05 using two–way ANOVA and Bonferroni post–test.
