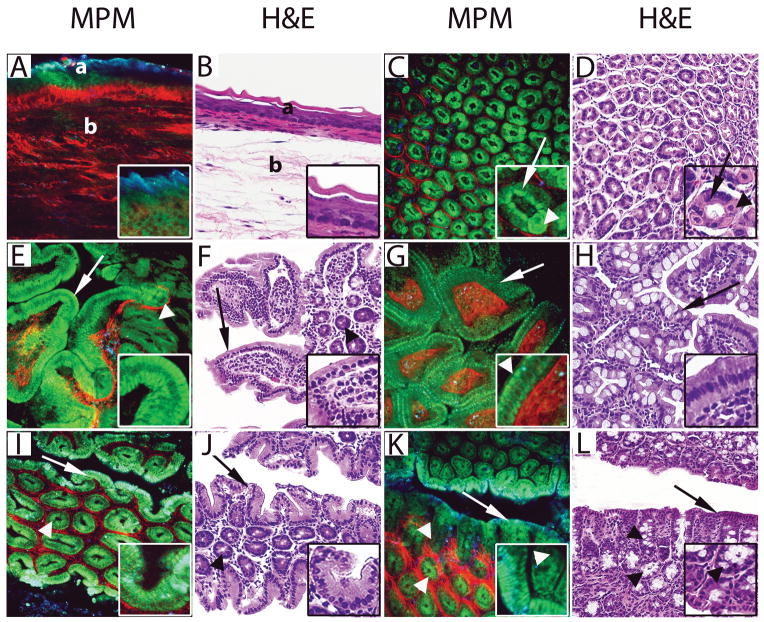
Figure 1.
Comparative MPM and H&E image atlas of the normal mouse gastrointestinal tract. A–B, The esophagus was imaged showing keratinized, stratified squamous epithelium lining the mucosa (a) and collagen bundles (red in MPM) and elastin fibers (green in MPM) in the submucosa (b). Insets in the MPM image show keratin (blue) and squamous cells (green). C–D, The stomach was imaged showing gastric glands (green in MPM) and the surrounding connective tissue (red in MPM). Insets show chief cells with basal nuclei (arrows) and large rounded parietal cells with central nuclei (arrowheads) lining a gastric gland. E–F, The duodenum was imaged showing villi (arrows) with core consisting of connective tissue (red in MPM) and mononuclear cells (mixture of blue and green cells in MPM) and crypts (arrowheads). Insets show enterocytes lining the villi. G–H, The ileum was imaged showing short and cylindrical villi (arrows) with the core consisting of connective tissue (red in MPM) and mononuclear cells (mixture of blue and green cells in MPM). Insets show enterocytes (green in MPM), microvilli (arrowhead in MPM) and connective tissue core (red in MPM). I–J, The cecum was imaged showing surface epithelium (arrows) and crypts of Lieberkühn (arrowheads). Insets show columnar epithelium of surface mucosa. K–L, The proximal colon was imaged showing surface epithelium (arrows) and crypts of Lieberkühn (arrowheads). Insets show surface epithelium and crypts lined by columnar epithelium and goblet cells (arrowheads).
(MPM total magnifications: A, C, E, G, I, K, = 300X, insets = 750X. H&E total magnifications: B, D, F, H, J, L, = 200X, insets = 400X).

