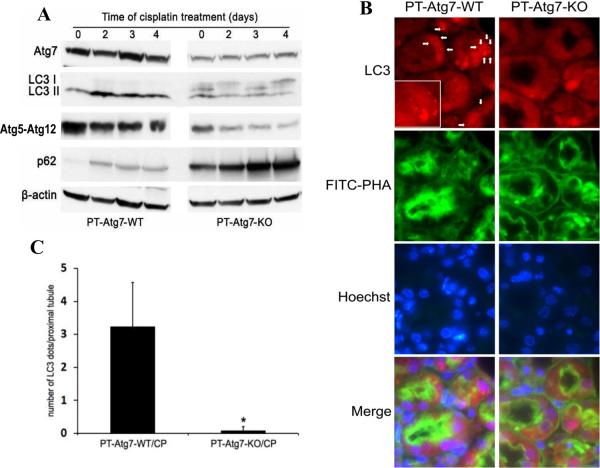
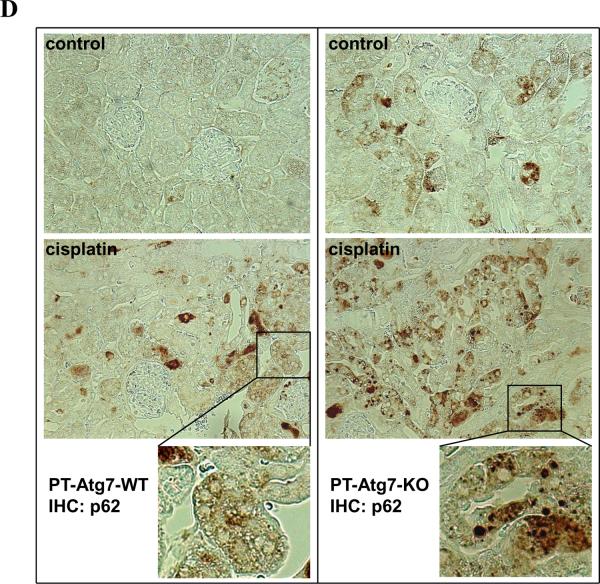
Figure 4. Cisplatin-induced autophagy is inhibited in renal proximal tubules in PTAtg7-KO mice.
Wild-type and PT-Atg7-KO mice were injected with 25mg/kg cisplatin or saline as control. (A) After the indicated time, kidneys were harvested to collect cortical tissues for immunoblot analysis of Atg7, LC3, Atg5 (Atg12 conjugated), p62, and β-actin. (B) Three days after injection, kidneys were collected for immunofluorescence staining of LC3, FITC-labeled PHA, and Hoechst33342 (×630). Representative images of cisplatin-treated wild-type and PT-Atg7-KO groups were shown. Arrows point to LC3 dots (autophagosomes) and inset shows LC3 dots at higher magnifications. (C) Quantification of LC3 dots in individual proximal tubule of cisplatin-treated wild-type and PT-Atg7-KO groups. Data are expressed as mean ± SD. * P < 0.05, significantly different from the wild-type group. (D) After 4 days of treatment, kidneys were collected for immunohistochemical staining of p62 (×200). The selected areas were shown at high magnifications.


