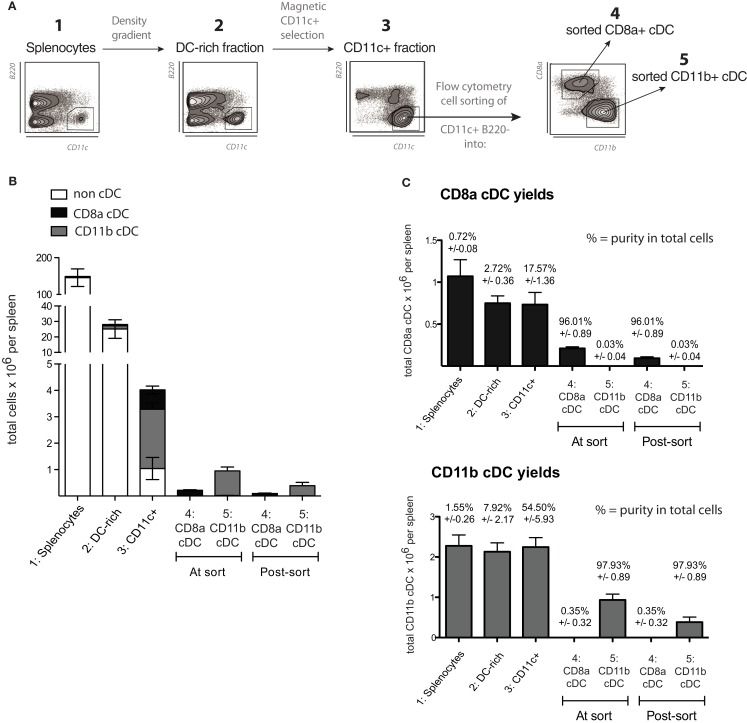
Figure 3.
Purification method and yields for the isolation of normal splenic cDC. (A) Schematic diagram of the method used to purify cDC subsets from spleen, as detailed in Section “Materials and Methods.” A representative plot of B220 versus CD11c is given for steps 1–3, showing the increasing purity of splenic cDC (CD11c+ B220− cells) throughout the procedure.(B,C) Yields based on total cell counts and purity for each splenic cDC subset in each sample throughout the isolation procedure, including the counts obtained during the cell sorting (indicated by the flow cytometry cell sorter) and the final yield based on sample counts after the cell sorting (n = 5). Data are presented as mean ± SD. (B) shows a vertically stacked bar graph of the yields to emphasize the very low relative frequency (and consequently yields) of splenic cDC subsets in total splenocytes. (C) Shows the yields and purities for each individual splenic cDC subset at each step of the isolation procedure. The values above each bar indicate purity ± SD.

