Figure 4.
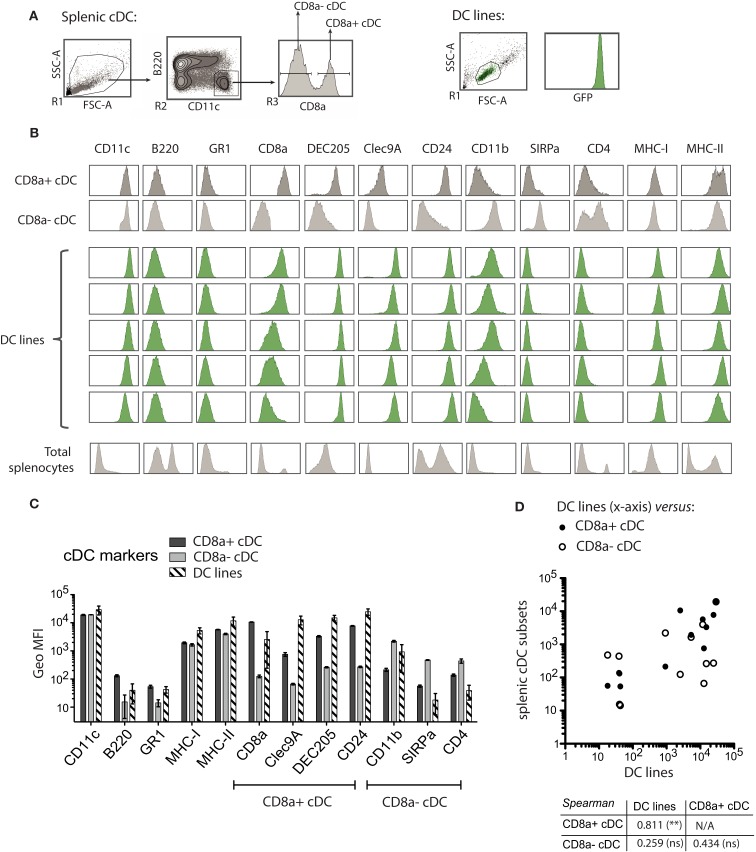
MutuDC lines share the expression profile of surface markers with the splenic CD8α+ cDC subset. (A) Gating strategy for the flow cytometry analysis of splenic cDC. MutuDC line cells (FSC versus SSC gate) were directly compared with splenic cDC. NB: MutuDC are eGFP positive. (B,C) The indicated surface markers were assessed on splenic cDC subsets (n = 2 per subset) and MutuDC lines (five independent DC lines). In (B), histograms show one representative sample for splenic cDC in parallel to five representative MutuDC lines (from top to bottom: MutuDC4525, MutuDC1940, MutuDC2069, MutuDC2114, MutuDC1995). Histograms of total splenocytes are also shown as staining controls. In (C), the geometric MFI is shown for the different surface markers as indicated for splenic cDC subsets (n = 2) and MutuDC lines (n = 5). Data are presented as mean ± SD. (D) Scatter plot and Spearman’s rank correlation coefficients based on the data shown in (B). The scatter plot shows the average geometric MFI value of each surface marker and compares MutuDC lines (x-axis) versus the two splenic cDC subsets (y-axis) as indicated. Below the scatter plot, the Spearman’s rank correlation coefficient (and its p-value) comparing all pairs of DC types is shown.

