Figure 6.
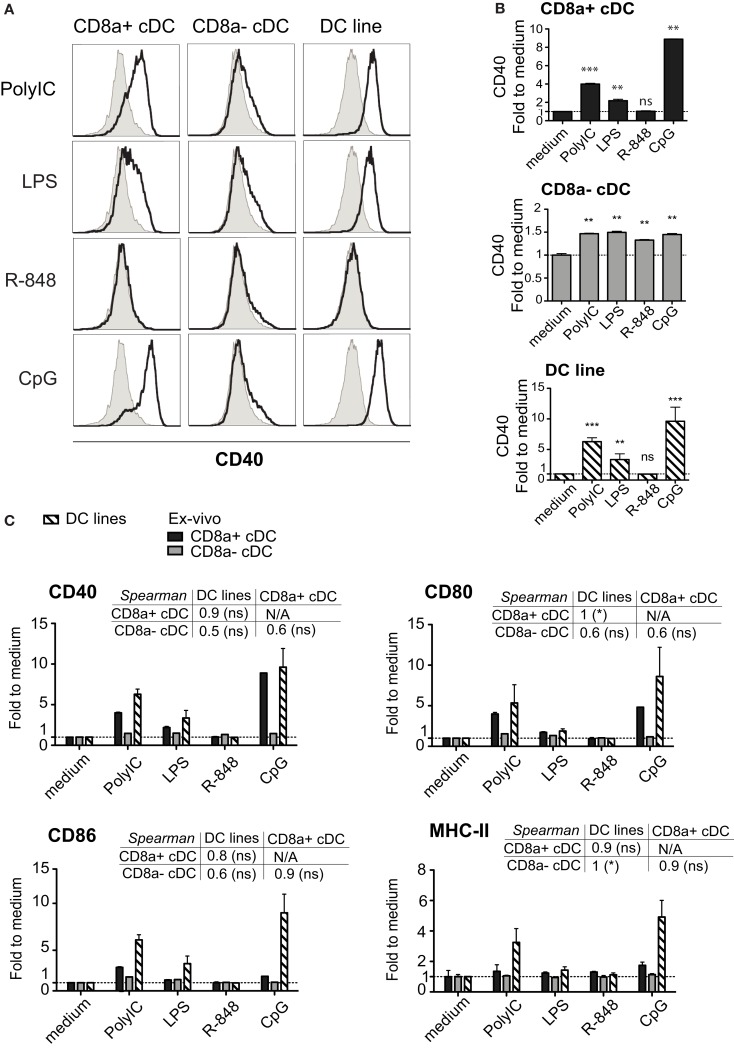
The activation profile of DC lines in response to TLR stimulation is characteristic of splenic CD8α+ cDC. DC lines (n = 4) and purified splenic cDC subsets (n = 2 per subset) were stimulated for 15 h with different TLR-Ls as indicated and analyzed for activation markers MHC-II, CD40, CD80, CD86. (A) Histograms show CD40 stainings for each stimulation (open) compared to medium (filled, gray). One representative sample is shown per DC type. (B) The geometric MFI of CD40 per treatment is shown individually for each DC type. (C). The geometric MFI of CD40, CD80, CD86, and MHC-II per treatment is shown for the three DC types, with the corresponding Spearman’s rank correlation (and its p-value) coefficient comparing all three types of DC. Data are presented as mean ± SD.

