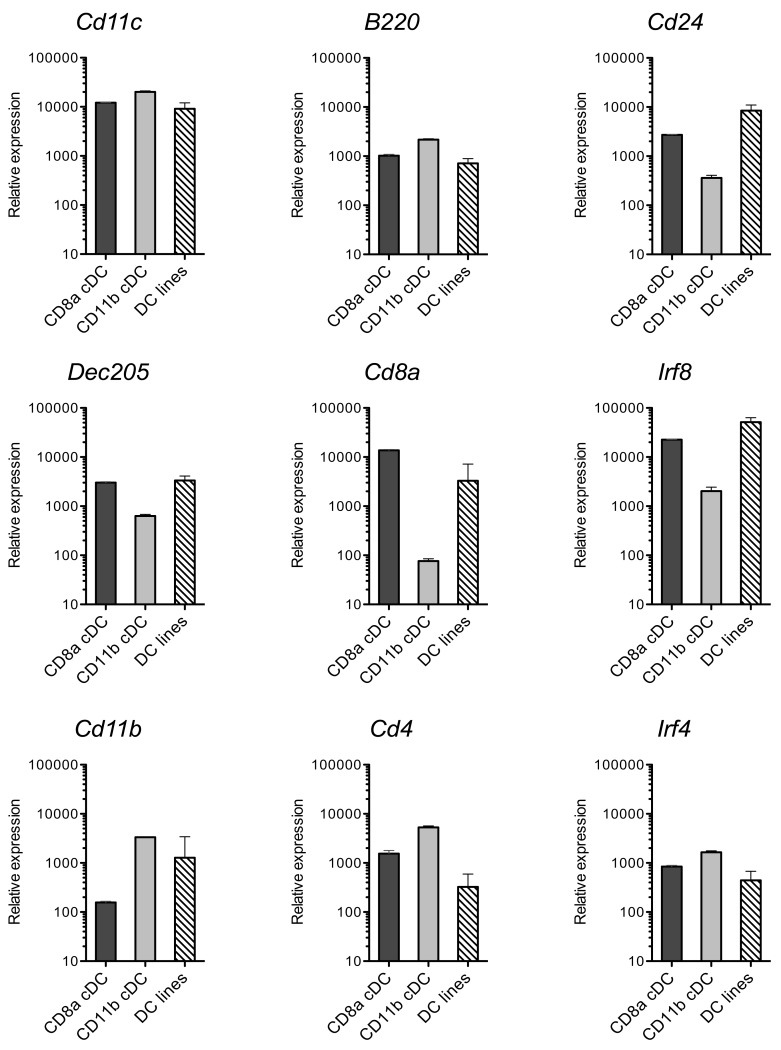
Figure A1.
MutuDC lines show a mRNA profile of DC markers similar to splenic CD8α+ cDC. In complement to the analysis in Figure 4, levels of mRNA for the indicated genes were quantified by Nanostring technology in 13 different MutuDC lines and compared to freshly sorted splenic cDC subsets (n = 3 per subset). Error bars indicate SD.

