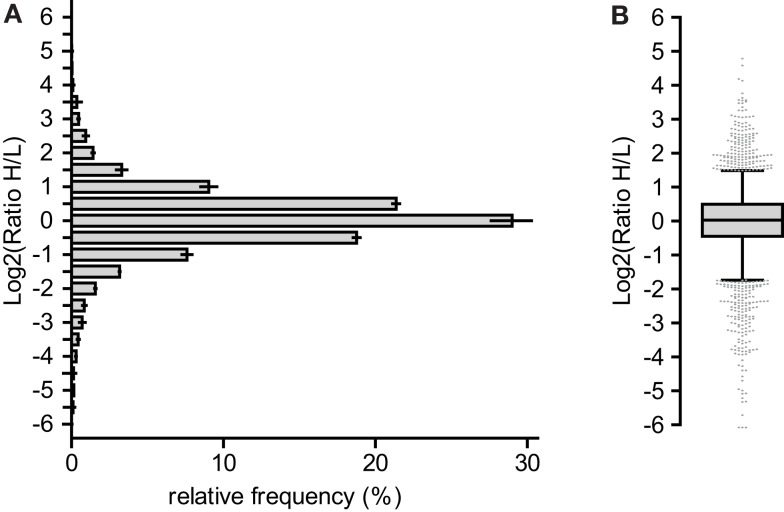
Figure A3.
Proteome analysis of DC line MutuDC1940 versus splenic CD8α+ cDC. Lysates of the DC line MutuDC1940 and freshly isolated splenic CD8α+ cDC were analyzed as detailed in Appendix and previously described (Luber et al., 2010). The MutuDC1940 was SILAC-labeled and mixed 1:1 with primary CD8α+ cDCs. (A) Histogram of the frequency distribution of ratios from MutuDC1940 (H) versus ex vivo CD8α+ cDCs (L). Center of the bins are indicated. (B) Ratios of all quantified protein as boxplot with median and whiskers from 5 to 95 percentile.

