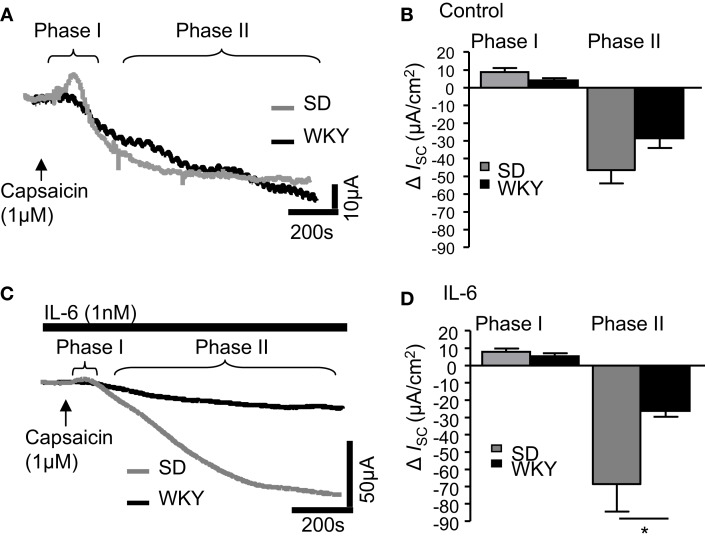
Figure 4.
IL-6 alters capsaicin-induced currents in Sprague Dawley (SD) and Wistar Kyoto (WKY) rat colons. (A) The representative traces illustrate the secretory (phase I) and anti-secretory (phase II) responses to capsaicin (1 μM) in control SD (gray line, n = 10) and WKY (black line, n = 10) distal colons. (B) The histogram illustrates the pooled data for changes in current (ISC). (C) The traces are representative of capsaicin-evoked responses following exposure to IL-6 (1 nM) in SD (n = 11) and WKY (n = 7). (D) The pooled data are plotted in a histogram. Values = mean ± SEM. * indicates p < 0.05.

