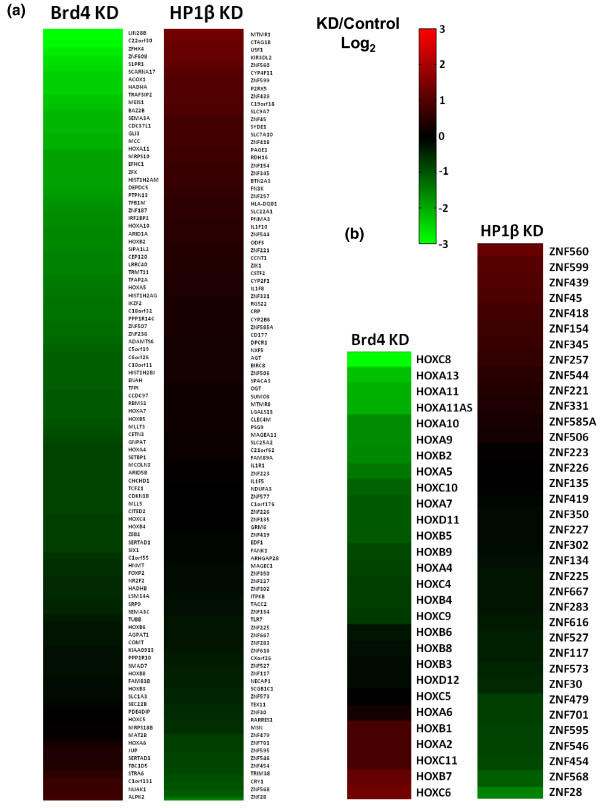
Figure 6.
Brd4 and HP1β regulate gene expression. (a) Right panel: heatmap showing the log2 fold change in gene expression from 293 cells with depleted Brd4 compared to control 293 cells. Genes shown are the top 100 genes whose promoter regions were the most enriched with Brd4 bound nucleosomes. Left panel: heatmap showing the log2 fold change in gene expression from 293 cells with depleted HP1β compared to control 293 cells. Genes shown are the top 100 genes whose promoter regions were the most enriched with HP1β-bound nucleosomes. (b) Right panel: heatmap of the log2 fold change in expression of all HOX genes with promoters bound by Brd4 in the Brd4-depleted 293 cell line compared to control 293 cells. Left panel: heatmap of the log2 fold change in expression of all ZNF genes found on chromosome 19 with promoters bound by HP1β in the HP1β-depleted 293 cell line compared to control 293 cells.

