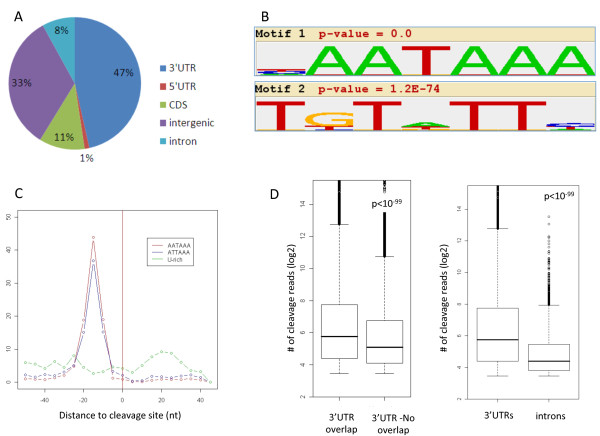
Figure 1.
Identification of poly(A) sites using 3'-Seq. (a) Distribution of the cleavage sites (CSs) identified by 3'-Seq into genomic regions. (b) Enriched motifs identified in the region spanning ±50 nucleotides with respect to the CSs that mapped to the 3' UTR. The top scoring motif corresponds to the canonical PAS and the second top corresponds to the auxiliary U-rich motif. (c) Location distribution of the enriched signals with respect to the position of the mapped cleavage sites. (d) Comparison between the strength of 3' UTR CSs (estimated by the number of sequenced reads that support their call) that either overlapped or did not overlap polyA-DB records (left), and between CSs that mapped to 3' UTR or introns (right). CDS, coding sequence; nt, nucleotide.

