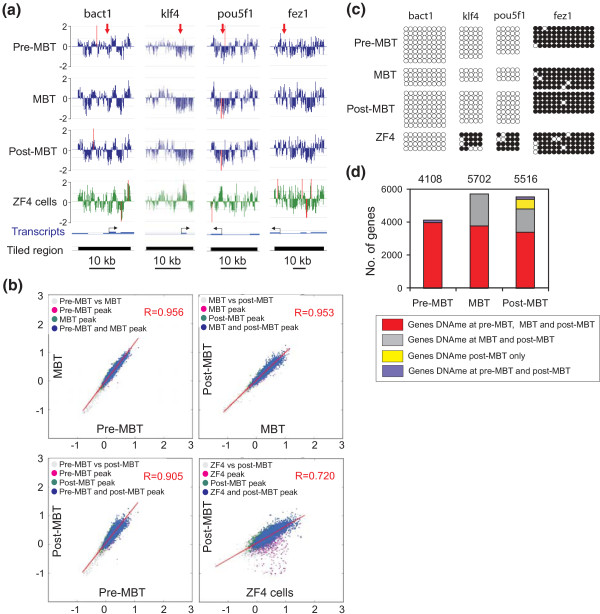
Figure 1.
Promoter DNA methylation states during the transition through the MBT period. (a) MeDIP-chip profiles of DNA methylation in tiled regions spanning a housekeeping gene (bact1) and developmentally regulated genes (klf4, pou5f1, fez1) (log2 MeDIP/input ratios), in pre-MBT, MBT, and post-MBT embryos and in the ZF4 fibroblast cell line. Red arrows in the upper track point to regions analyzed by bisulfite sequencing in (b). (b) Two-dimensional scatter plots of MaxSixty values for MeDIP log2 signal intensities at indicated developmental stages (pairwise) and in ZF4 cells. Average MaxSixty values for both MeDIP replicates are plotted for each stage. Data points are colored to indicate classification according to peak calling algorithm, to show methylated promoters in one only (purple, green) or both (blue) stages. (c) Bisulfite sequencing validation of MeDIP-chip data shown in (a); 5' to 3' orientation; filled circles indicate methylated cytosine; empty circles indicate unmethylated cytosine. (d) Numbers of methylated genes pre-MBT, MBT and post-MBT. Color reflects genes whose methylation is maintained between stages.

