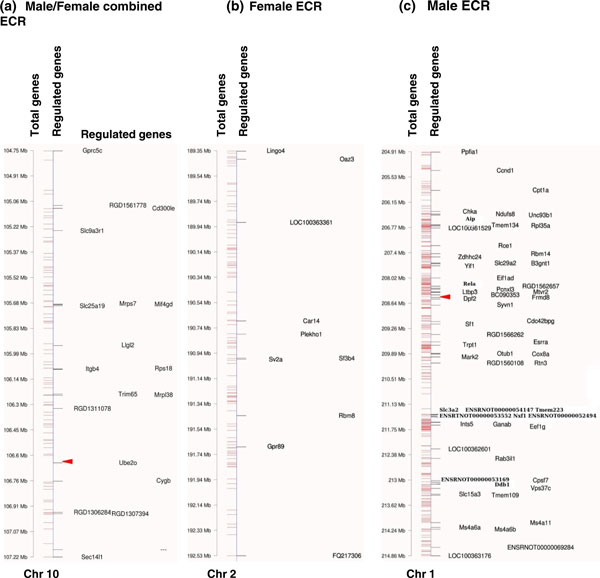
Figure 8.
Representative epigenetic control regions (ECRs) identifying regulated genes in single ECRs. (a) ECR selected from male and female tissues combined (overlapped). (b) ECR selected from female only tissues. (c) ECR selected from male only tissues. The location of all genes (total genes) on chromosomes 1, 2 and 10 are shown in megabases and regulated genes are named. The arrowhead identifies the location of a known rat long non-coding RNA.

