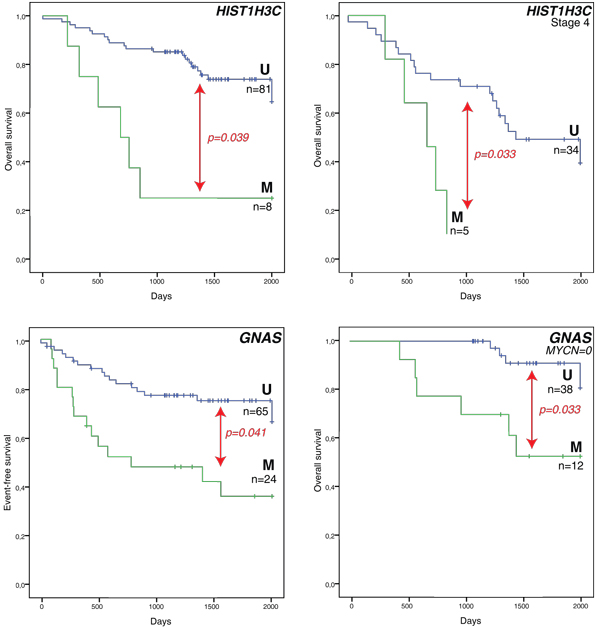
Figure 3.
Methylation of HIST1H3C and GNAS is associated with worse survival outcome. Kaplan-Meier plots on the left show overall survival or event-free survival for all 89 primary neuroblastoma samples, those on the right overall survival in a specific stratum based on one of the risk factors only. Survival curves indicated with 'M' are the methylated samples, survival curves associated with the unmethylated assay are indicated with 'U'. The numbers of patients are indicated (n) and P-values are determined using a log-rank test (Mantel-Cox; multiple testing correction by Benjamini-Hochberg). Time is indicated in days, starting from diagnosis and censored to 2,000 days (censored samples are indicated with vertical lines crossing the overall survival curves). MYCN = 0: MYCN single copy.

