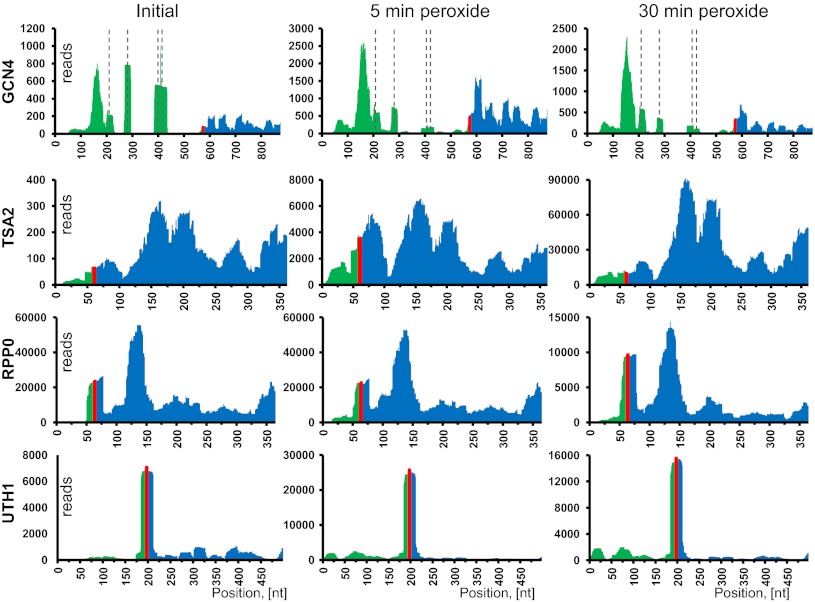
Fig. 2.
Examples of 5′-UTR translation during oxidative stress. Ribosome footprint coverage for four different mRNAs discussed in the text illustrates various patterns of translation. Panels show the footprint coverage of certain mRNAs with no in-frame stop codons upstream of annotated genes. For each mRNA, translation following 5- and 30-min hydrogen peroxide treatment is given. Untreated yeast cells served as a control. The entire 5′ UTR and 300 nt of the gene sequence were used to generate the coverage density map. The 5′-UTR part of the mRNA is shown in green, the AUG start codon in red, and the annotated gene in blue. Dashed lines in GCN4 graphs indicate positions of known uORFs.

