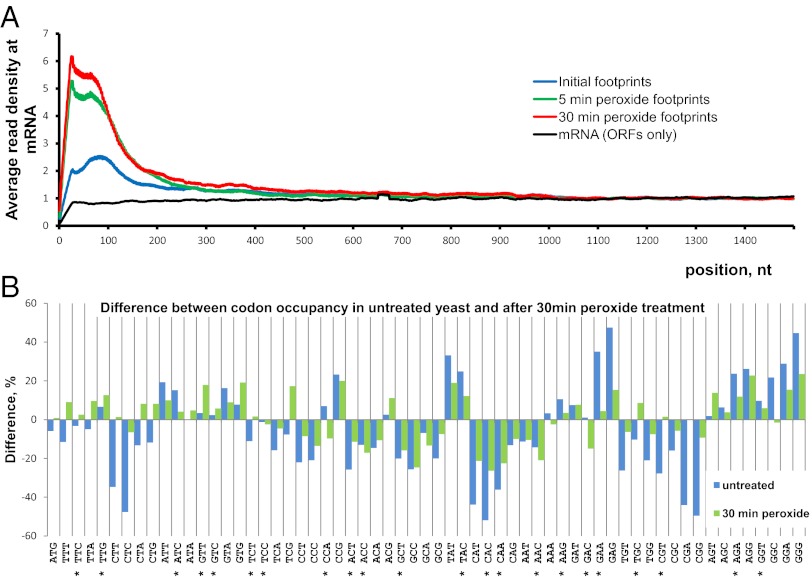
Fig. 5.
Global features of translation examined by Ribo-seq. (A) Density of footprint coverage along the mRNA. Profiles of read coverage were calculated for each mRNA longer than 1,500 nt and rpkm >10. The profiles were normalized based on the average density in the region from 1,000–1,500 nt. Densities for each nucleotide position were averaged across all mRNAs. An average between the two experimental replicates is shown. (B) Ribosomal occupancy of individual codons measured in vivo. Percentage of difference is calculated between the predicted codon distribution across mRNAs and the experimental codon appearance at the ribosomal A site. For details of normalization and prediction, see SI Materials and Methods. Codon values greater than zero are encountered more often at the A site of ribosome. Asterisks mark codons with the highest RSCU values (21). Blue bars represent untreated control; green bars represent samples treated for 30 min with 0.2 mM hydrogen peroxide.

