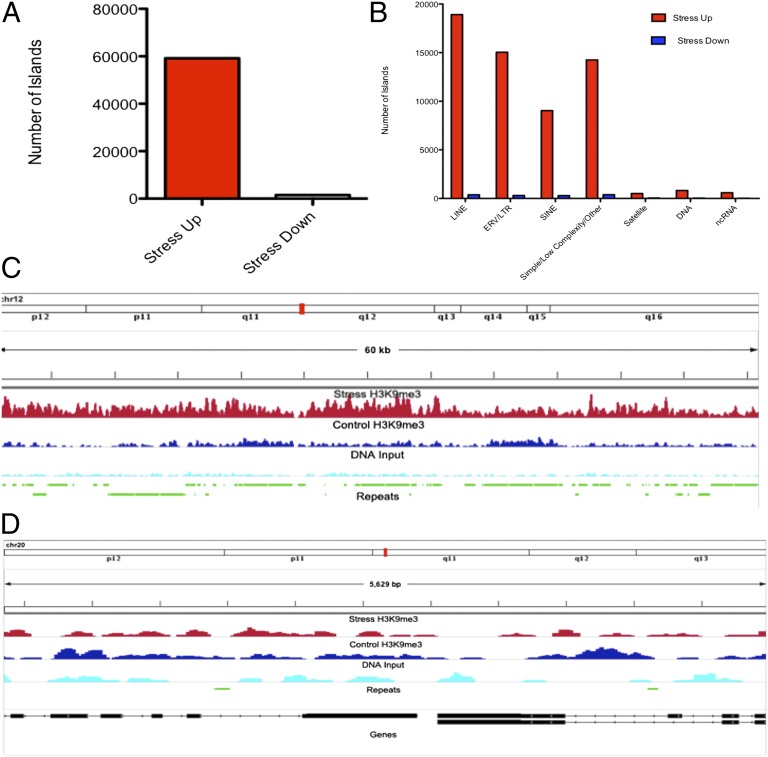
Fig. 3.
Analysis of genomic regions showing statistically significant differences in H3K9me3 enrichment between stress and control conditions revealed profound increases in H3K9me3 enrichment after stress. Total number of genomic islands aligned to repetitive elements showing significant increases in H3K9me3 enrichment after stress (stress up, red) or decreased enrichment (stress down, blue) are shown (A). (B) These reads are categorized by repeat type. (C) A representative stress up 60-Kb region of chromosome 12, along with known repetitive elements. (D) A stress-down region along with gene and repeat alignments, demonstrating the pronounced bias toward stress induced increases in H3K9me3 levels in regions of high repetitive-element density.

