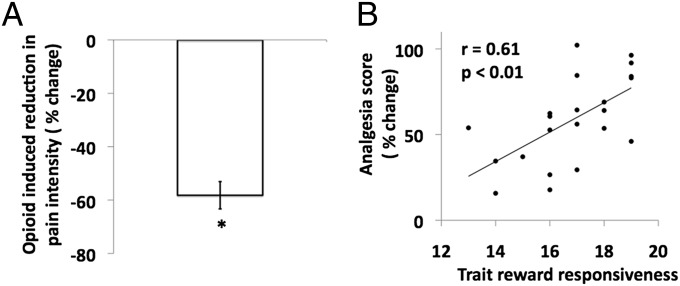
Fig. 1.
Opioid-induced reduction in pain intensity and behavioral analgesia. (A) Y axis shows the mean opioid-induced reduction in pain intensity (percentage of change) of heat noxious stimuli. The opioid-induced reduction in pain intensity is defined as [v opioid(infusion−preinfusion)] − [v saline(infusion–preinfusion)], where v is the pain intensity. Error bars indicate SEM (one-sample t test; *P < 0.01). (B) Scatter plot of significant positive correlation (r = 0.61; P = 0.002) between the opioid-induced behavioral analgesia as percentage of change in pain intensity (y axis) and the trait reward responsivness score (x axis). To depict analgesia as a positive value, it is defined as [v opioid(preinfusion−infusion)] − [v saline(preinfusion−infusion)], where v is pain intensity. Pearson’s r and P values are shown in the scatter plot.

