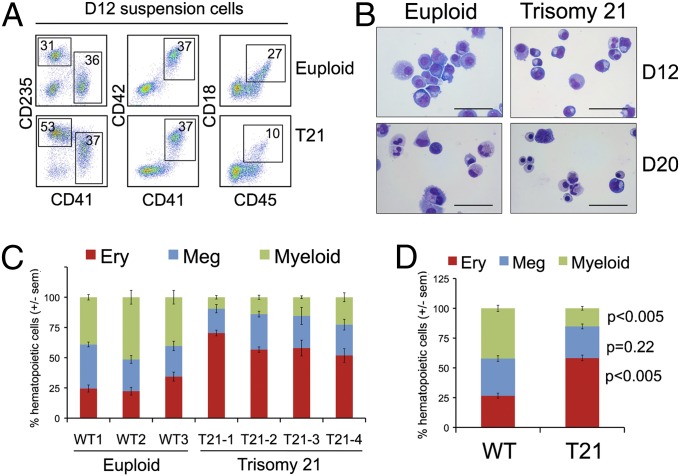
Fig. 2.
Propensity for erythroid differentiation by T21 iPSCs. (A) Flow cytometry analysis of suspension cells in day 12 differentiation cultures showing mature hematopoietic lineages: erythroid (Ery, CD41−235+), megakaryocytic (Meg, CD41+42+), and myeloid (CD45+18+). (B) May–Grunwald Giemsa-stained cells from EB suspension cultures at days 12 and 20. (Scale bars, 50 μm.) (C) Distribution of lineage-committed cells in EB suspension cultures at days 12–14 of differentiation. n = 3–5 independent experiments per iPSC line. (D) Summary of data with all iPSC lines combined according to genotype (n = 15 per group).

