Fig. 4.
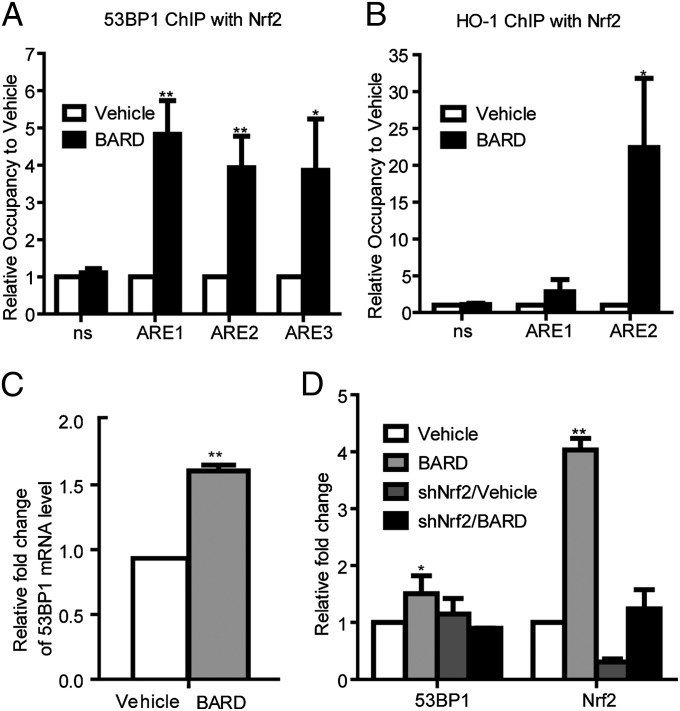
Nrf2 increases 53BP1 expression by BARD treatment. ChIP-qPCR analysis of Nrf2 occupancy on the 53BP1 (A) and HO-1 (B) promoters using unirradiated cells following treatment with vehicle or BARD for 18 h. Data shown are from two separate triplicate experiments. (C) Quantitation of 53BP1 mRNA levels by RT-qPCR analysis showing increase of 53BP1 expression with BARD treatment for 18 h. Data shown are from two separate experiments and are normalized to GAPDH. (D) Quantitation of Western blot analysis showing increase of 53BP1 with BARD treatment for 18 h. Data shown are from two separate experiments and are normalized to β-actin. *P < 0.05 and **P < 0.005 (compared with vehicle control) in the unpaired Student t test; ns, not significant differences in the unpaired Student t test.

