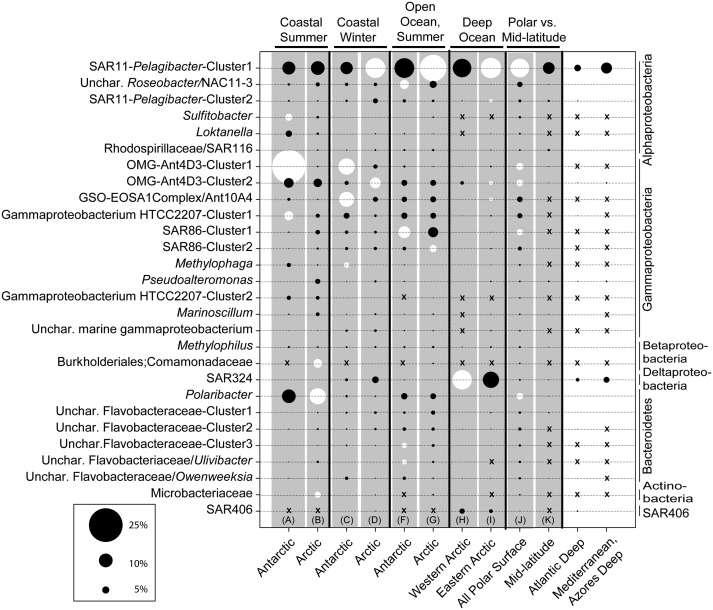
Fig. 4.
Bacterial OTUs associated with the polar ecosystem clusters identified in Fig. 2 (clusters A to H). SSU rRNA gene tags (distance of 0.03) were averaged across each ecosystem cluster (3–29 samples per cluster) and summed across the eight polar ecosystems. Shown are OTUs representing 5% or greater in each compared ecosystem cluster (totaling 28 OTUs), where the circle size corresponds to the relative average abundance the OTU in each cluster. OTUs assigned to the highest taxonomic level possible using a Bayesian classification tool (RDP) BLAST and sequence alignments to polar SSU rRNA gene clone libraries, are grouped phylogenetically on the vertical dimension. OTUs with average relative abundances < 0.01 (rare OTUs in a fraction of the samples in an ecosystem cluster) are indicated with an x, whereas very low values (0.01–0.5) appear as a continuation of dashes. Pairwise comparisons of ecosystem clusters (delimited with vertical black lines and gray background) were conducted using SIMPER to determine OTUs contributing to dissimilarity between the clusters. Dominant tags (top five to six OTUs) that contributed to dissimilarity between two clusters are in white. For example, the six frequent OTUs explaining the dissimilarity between the coastal surface summer samples in the Antarctic and the Arctic included three Antarctic OTUs: Sulfitobacter, OMGAnt4D3-cluster1, Gammaproteobacterium HTTC 2207-Cluster1, and three Arctic OTUs: Burkholderiales, Polaribacter, and Microbacteriaceae); the discerning OTUs are often distributed between the two clusters being compared.

