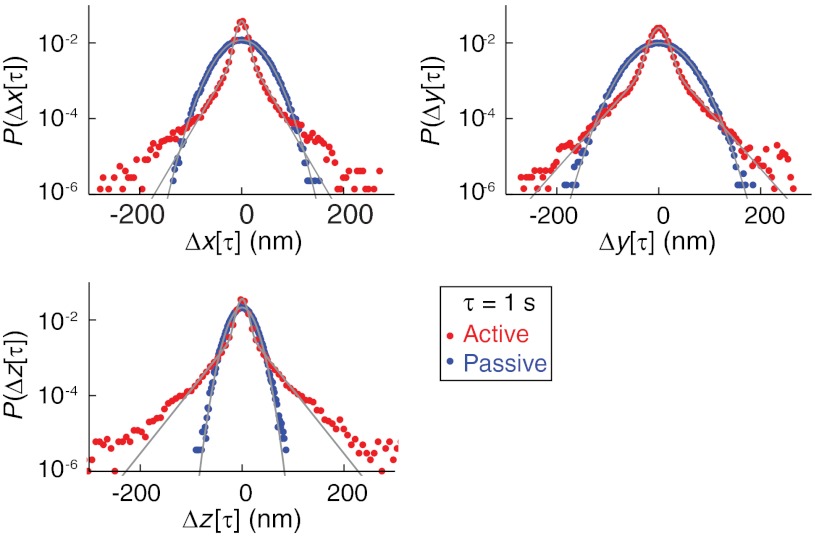
Fig. 3.
Van Hove correlation functions, P(Δr(τ)), of active and passive gel fluctuations in each dimension, r = x, y, or z. P(Δr(τ)) was calculated from the three-dimensional trajectory of a bead attached to the same gel in both the passive and active state. The gray lines show the best fits to either the normal distribution (passive data) or a summed normal/exponential distribution (active data).

