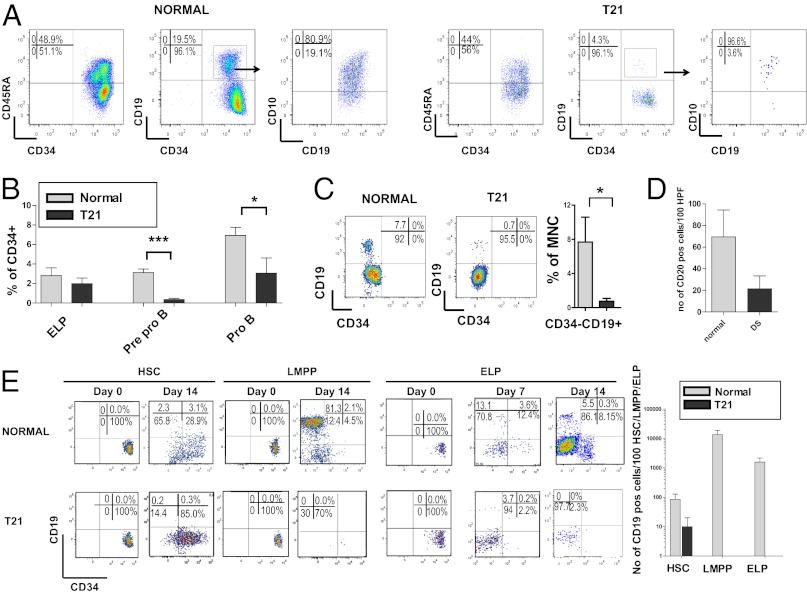
Fig. 3.
Impaired lymphoid differentiation of T21 FL HSC, LMPP, and ELP. (A) Representative plots from normal (Left; n = 11) and T21 (Right; n = 6) FL showing reduced Pre-proB (CD34+CD19+CD10−) and ProB progenitors (CD34+CD19+CD10+). (B) Mean B-lymphoid progenitor frequencies in normal (light bars; n = 11) and T21 (n = 6) FL (dark bars) showing reduced PreProB and ProB progenitors in T21 FL. ***P < 0.001; *P < 0.02. (C) Representative plots showing reduced CD34−CD19+ cells in T21 compared to normal FL and summary data in normal (light bars, n = 5) and T21 FL (dark bars, n = 8). *P < 0.05. (D) Mean number of CD20+ cells/high-power fields from normal (n = 4; light bars) and T21 FL (n = 4; dark bars). (E) Differentiation of flow-sorted 100 HSC, LMPP, and ELP on MS5 stroma showing representative results on day 0 and day 14 (day 7 also shown for ELP) from normal (n = 3) and T21 FL (n = 4) and (Right) mean absolute number of CD19+ cells on day 14 from normal FL HSC, LMPP, and ELP (light bars) or T21 HSC, LMPP or ELP (dark bars).

