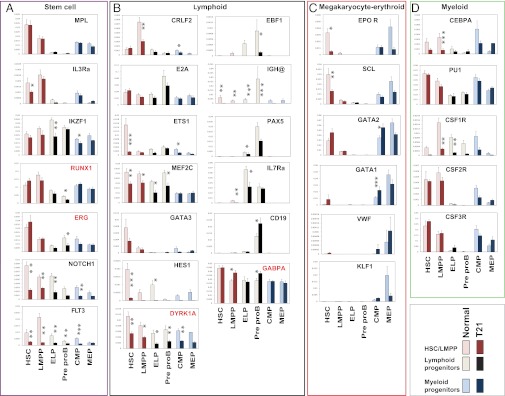
Fig. 4.
(A–D) Altered gene expression in T21 FL HSC/progenitors Mean gene expression levels by quantitative RT-PCR from flow-sorted HSC/progenitors (50 cells in triplicate for each population) from normal (n = 5; light bars) and T21 FL (n = 3; dark bars) shown relative to GAPDH. Significant differences between T21 and normal FL are shown as *P < 0.05; **P < 0.01, and ***P < 0.001, using Bayesian analysis of differences in mean (see SI Experimental Procedures).

