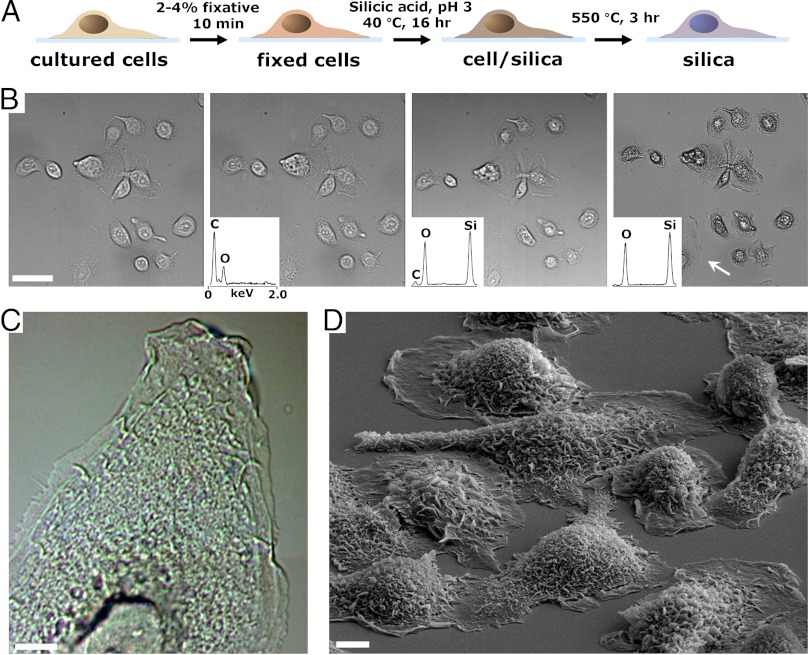
Fig. 1.
Silicification of mammalian cells cultured on flat substrates. (A) Schematic describing the process of cell silicification. (B) Image field of AsPC-1 cells throughout the steps (noted above) of silicification. Images in (i) and (ii) show hydrated cells and (iii) and (iv) show dehydrated composites and silica replicas. Insets show representative Energy Dispersive Spectroscopy spectra of cells at the various stages. (C) Close-up differential interference contrast (DIC) image of the cell noted by the white arrow in B, Right. (D) Representative SEM image of AsPC-1 templated cell silica following calcination. (Scale bars, B: 40 μm ; C and D: 5 μm.)

