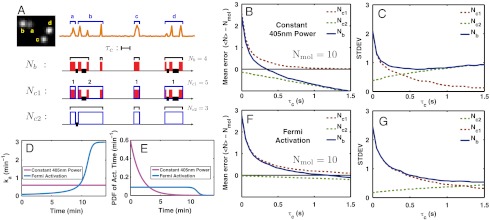
Fig. 4.
Error in counting multiple Dendra2 molecules in vitro. Dendra2 molecules were illuminated simultaneously with both 405 nm and 561 nm lasers. (A) A constructed multiple-molecule emission pattern (orange line) by grouping together the emission traces of four spatially separated molecules (a, b, c, and d, Left). Two molecules blinked (b and d) and the other two did not (a and c). Nmol is the actual number of molecules, there are four in this example. Nb is the number of molecules counted from this constructed emission pattern by our counting method. (Nc1 - Nmol) and (Nc2 - Nmol) represent the overcounting error due to blinking and undercounting error due to mixing, respectively. Nb, Nc1, and Nc2 are calculated as explained in the text. A red band represents an emission burst and a blue box encloses emission bursts of one molecule identified by using the spatial information from the EMCCD image on the left. Thick black lines mark the time intervals shorter than the value of the τc (represented by the length of a line segment). A black bracket encloses the bursts that belong to the presumed single molecule when our counting test is applied. Hence, the error of counting or molecular identification can be quantified by comparing the black brackets with the blue boxes. (B) Mean and (C) standard deviation to count 10 Dendra2 molecules by using Nb, Nc1, and Nc2 for 405 nm laser power fixed to 3.5 mW/mm2 employing different values of τc (Fig. S5 for distributions). (D and E) Fermi activation produces an almost uniform PDF of activation time, which temporally separates emissions of different molecules most efficiently, thus decreasing the counting error. (F and G) Counting test for Fermi activation with tF = 670 s and T = 20 s.

