Fig. 5.
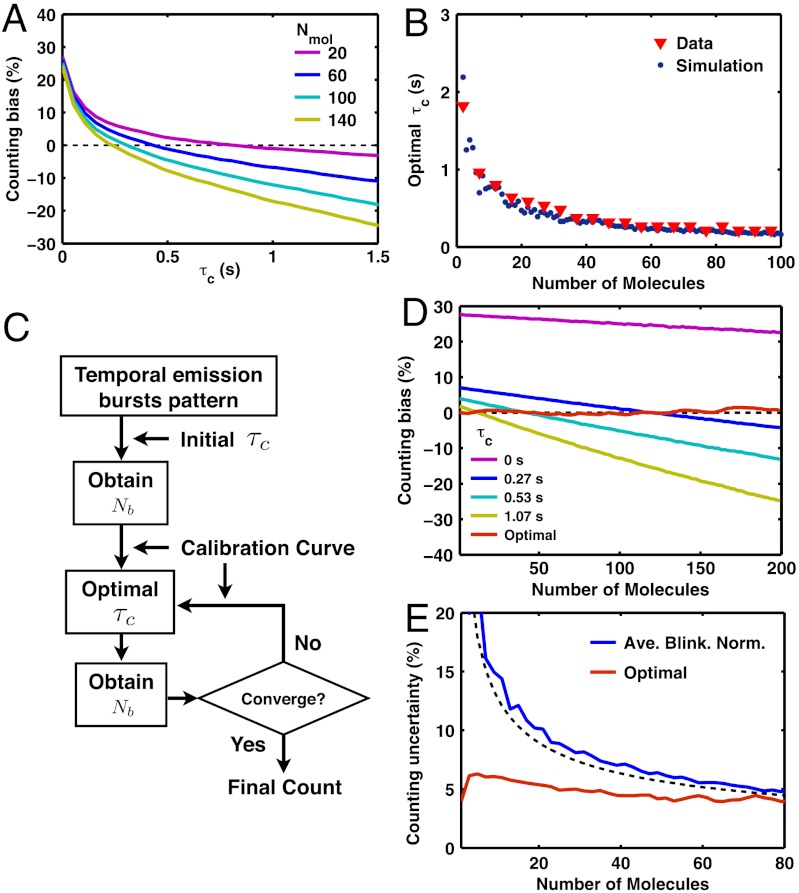
Method of iterative optimal-τc molecular counting. (A) Dendra2 under Fermi activation with tF = 670 s and T = 20 s shows that a large value of τc and a large number of molecules tend to bias down the counting; i.e., the mean of Nb gets smaller than Nmol (dashed black line). (B) For a given number of molecules, there exists an optimal value of τc in which the bias error is eliminated by balancing the over- and undercounting error. The simulation result (blue dots, see text) shows a good agreement with the τc obtained from the experimental data (red triangles). (C) Iterative optimal-τc counting algorithm that achieves a minimal bias error (see text). (D) Optimal counting method removes the bias error (≤ 2%) for counting between 1 and 200 Dendra2 molecules. In contrast, the use of constant values of τc shows significant bias errors. (E) With the bias error eliminated, the final counting error is given by the counting uncertainty; i.e., the standard deviation (≤ 6.2%) for iterative optimal-τc counting (red line, only shown up to 80 molecules). In comparison, the result of average-blinking normalization method (see text) provides unbiased counting with a reasonably small uncertainty, although less accurate than the iterative optimal-τc method (blue line, data; black dashed line, SI Text, Eq. S45). All the results, except the simulation data in B, were obtained from the counting tests (Fig. 4) on Dendra2 in vitro experimental data.

