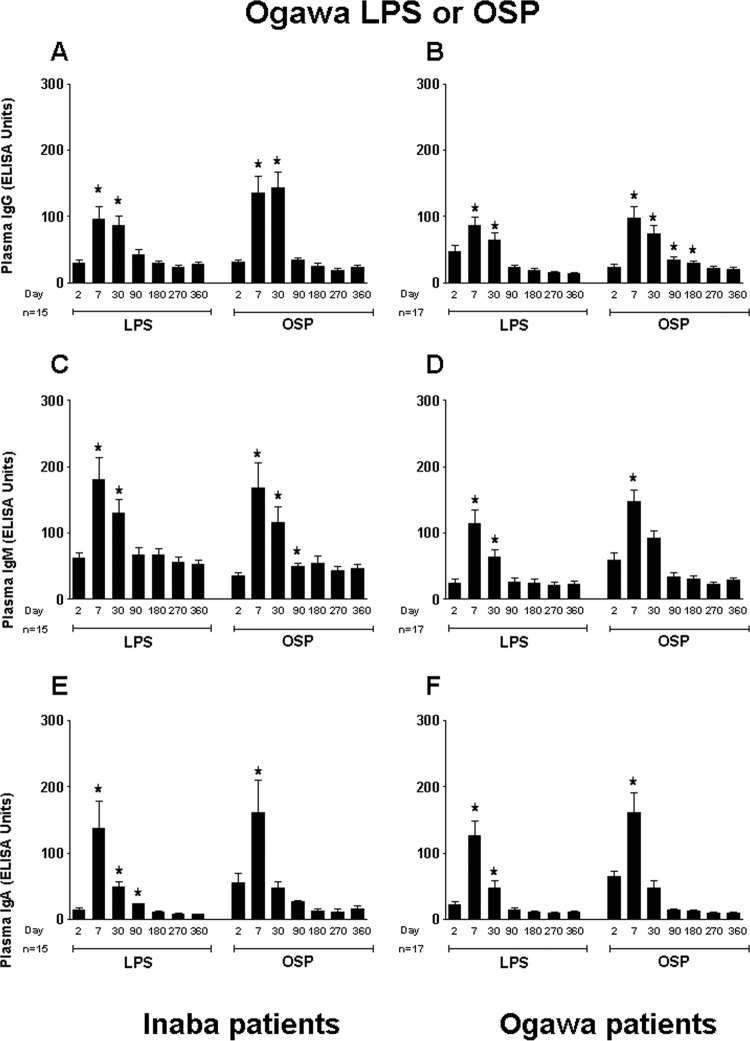
Fig 2.
Mean normalized IgG, IgM, and IgA responses in plasma of patients infected with V. cholerae O1 serotype Ogawa or Inaba to Ogawa OSPc:BSA (OSP) and lipopolysaccharide (LPS). Plasma IgG, IgM, and IgA responses to Ogawa OSP and LPS in Inaba-infected patients are shown in panels A, C, and E, and those in Ogawa-infected patients are shown in panels B, D, and F. Asterisks indicate a statistically significant difference (P ≤ 0.05) from baseline (day 2) levels within a particular antigen group.

